- ホーム
- IIBA
- CBAP-JPN - Cetified business analysis professional (CBAP) appliaction (CBAP日本語版)
- IIBA.CBAP-JPN.v2024-04-23.q211
- 質問156
有効的なCBAP-JPN問題集はJPNTest.com提供され、CBAP-JPN試験に合格することに役に立ちます!JPNTest.comは今最新CBAP-JPN試験問題集を提供します。JPNTest.com CBAP-JPN試験問題集はもう更新されました。ここでCBAP-JPN問題集のテストエンジンを手に入れます。
CBAP-JPN問題集最新版のアクセス
「499問、30% ディスカウント、特別な割引コード:JPNshiken」
保険会社は、1暦年以内に売上を15%増やし、顧客維持を10%増やしたいと考えています。
これを達成するためのさまざまな戦略が検討され、これらの目標を達成するために既存の価格設定モデルへの再構築が選択されました。
ビジネスアナリスト(BA)は、アクチュアリー、製品スペシャリスト、営業スタッフ、リスクマネージャー、引受会社などの利害関係者と協力して、以下に基づいてさまざまなレベルの割引を顧客に適用することに同意します。
*顧客が会社に対して持っている年間保険料の合計(金銭的価値)
*保険会社との時間(忠誠)
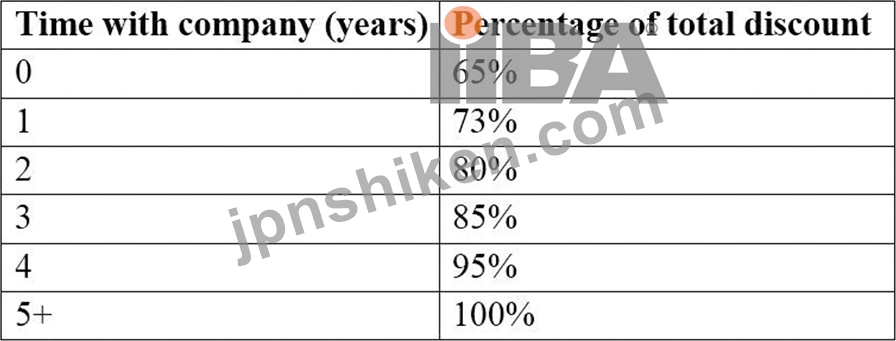
さまざまな財務モデルが検討されていますが、利害関係者は、最初の適用可能な割引が顧客の全体的な保険料に基づいて決定されることに同意しています。
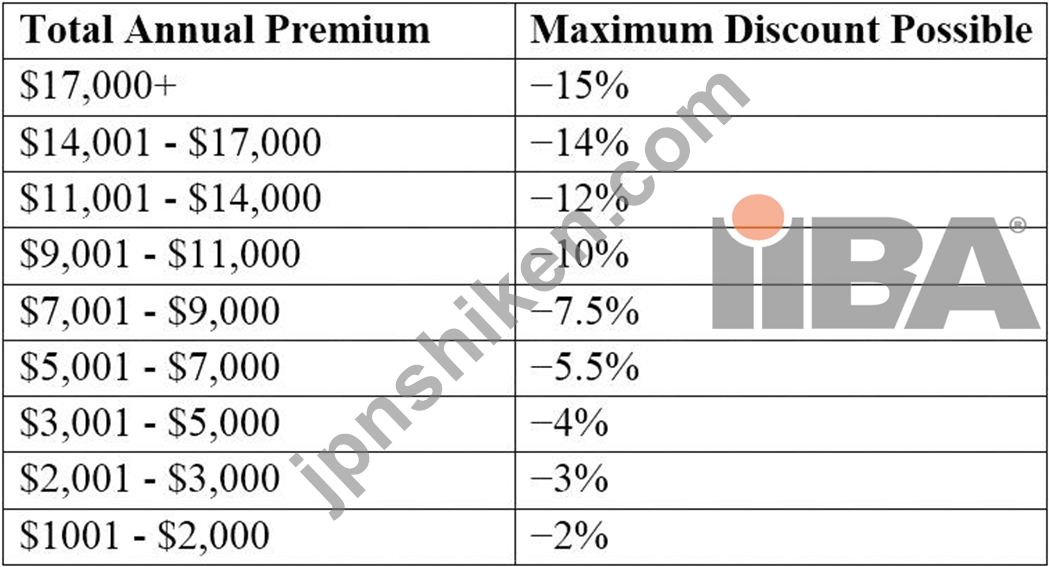
顧客が利用できる最大の割引の割合は、会社との時間に基づいて調整されます。
含まれる必要のあるすべての人が確実に含まれるようにするために、BAは何を作成しましたか?
これを達成するためのさまざまな戦略が検討され、これらの目標を達成するために既存の価格設定モデルへの再構築が選択されました。
ビジネスアナリスト(BA)は、アクチュアリー、製品スペシャリスト、営業スタッフ、リスクマネージャー、引受会社などの利害関係者と協力して、以下に基づいてさまざまなレベルの割引を顧客に適用することに同意します。
*顧客が会社に対して持っている年間保険料の合計(金銭的価値)
*保険会社との時間(忠誠)
さまざまな財務モデルが検討されていますが、利害関係者は、最初の適用可能な割引が顧客の全体的な保険料に基づいて決定されることに同意しています。
顧客が利用できる最大の割引の割合は、会社との時間に基づいて調整されます。
含まれる必要のあるすべての人が確実に含まれるようにするために、BAは何を作成しましたか?
正解:A
Explanation
An onion diagram is a technique that helps to identify and analyze the stakeholders involved in a project or a solution. It consists of a series of concentric circles that represent different levels of stakeholder influence and interest. The innermost circle contains the core stakeholders who have the highest influence and interest, such as the project team and the sponsor. The outermost circle contains the peripheral stakeholders who have the lowest influence and interest, such as the regulators and the competitors. The circles in between contain the primary and secondary stakeholders who have varying degrees of influence and interest, such as the customers, the suppliers, the partners, etc. An onion diagram helps to ensure that everyone who needed to be included has been considered and engaged appropriately.
References:
[BABOK Guide v3], Section 2.2: Identify Stakeholders, p. 16-17
CBAP / CCBA Certified Business Analysis Study Guide, 2nd Edition, Chapter 2: Business Analysis Planning and Monitoring, p. 48-49 Certified Business Analysis Professional (CBAP) Specialization, Course 1: Business Analysis:
Planning and Monitoring, Week 2: Plan Business Analysis Governance, Video: Stakeholder Identification Techniques Onion Diagram - Stakeholder Mapping, Blog Post, June 2018

- 質問一覧「211問」
- 質問1 次のうち、調達文書はどれですか?
- 質問2 一般責任および物的損害保険の非常に大規模な保険会社は、過去5
- 質問3 ビジネスアナリスト(BA)がビジネスのニーズを満たすことを可能...
- 質問4 次の文書のうち、以下のステートメントで説明されているものはど
- 質問5 大手医療提供者は最近、患者の回復活動を調整する活動の一部を自
- 質問6 次の図のうち、石川図として知られているものはどれですか?
- 質問7 ビジネスニーズプロセスの定義のどの部分が、組織が達成しようと
- 質問8 医療保険プロバイダーは、モバイル アプリケーション プラットフ...
- 質問9 住宅ローンに従事する金融機関は、成長を妨げる活動を排除し、最
- 質問10 タスクに関与する人の役割と責任を確実に追跡するために重要なチ
- 質問11 ビッグインフォメーションテクノロジー(lT)部門を持つ企業は、...
- 質問12 銀行の請求メカニズムに代わる主要なプロジェクトに取り組んでい
- 質問13 人気のあるデパートチェーンは、今後2年間で、100店舗すべての収...
- 質問14 ビジネスアナリスト(BA)は、国際銀行向けのグローバルな外貨両...
- 質問15 プロジェクト計画の次のグラフィカルなプレゼンテーションのうち
- 質問16 旅行代理店モバイルアプリケーションのベータ版をリリースした後
- 質問17 あなたはあなたの組織のビジネスアナリストです。現在のプロジェ
- 質問18 次のうち、プロジェクトが組織内に存在することを許可しているの
- 質問19 プロジェクトがプロジェクトスケジュールから外れ、問題が含まれ
- 質問20 次のうち、どの利害関係者が他の利害関係者に情報を提供するかの
- 質問21 マークは彼の組織のビジネスアナリストです。マークと彼の事業分
- 質問22 ビジネスアナリスト(BA)は、要件を指定する準備をしています。...
- 質問23 ゾーイは彼女の組織のビジネスアナリストです。彼女は現在、ソリ
- 質問24 創造的思考プロセスには、プロセスの有効性を判断するための3つ
- 質問25 最短の実装と最長の実装の間の日数の時間差はどれくらいですか?
- 質問26 あなたの組織は、2つの機会のうちどちらを追求するかを決定しよ
- 質問27 次のプロセスのどれが、タスクと役割、リスクカテゴリ、リスク管
- 質問28 マーサは、ゲイリーが要件を引き出すプロセスの一環として、いく
- 質問29 あなたは組織のビジネスアナリストであり、要件の検証プロセスを
- 質問30 ヘンリーは彼の組織のビジネスアナリストであり、行動誘発活動を
- 質問31 今後の変更イニシアチブについて、いくつかのリスクが特定されま
- 質問32 次のうち、さまざまなプロジェクトチームメンバーの役割と責任を
- 質問33 あなたは組織のビジネスアナリストであり、要件のトレーサビリテ
- 質問34 プロジェクト作業の完全性を判断し、プロジェクトを前進させるた
- 質問35 要件を引き出すために、ビジネスアナリスト(BA)は、ビジネスド...
- 質問36 あなたは組織のビジネスアナリストであり、別のビジネスアナリス
- 質問37 次のフェーズのうち、事業継続計画を作成するための最初のステッ
- 質問38 あなたはあなたの組織のビジネスアナリストです。経営陣は、あな
- 質問39 要件管理の取り組みにおいて、ビジネス アナリスト (BA) はすべ...
- 質問40 ベンは彼の組織のビジネスアナリストです。ベンは現在、レーザー
- 質問41 イニシアチブの成功基準を決定するとき、ビジネスアナリスト(BA...
- 質問42 組織内で特定された問題のソリューションスコープを作成していま
- 質問43 大手保険会社は、新しい請求処理システムを購入するか、既存の 2...
- 質問44 ソフトウェア実装プロジェクトの要件を検証する際、ビジネスアナ
- 質問45 プロジェクトにさらに投資する前に、顧客とプロジェクトの利害関
- 質問46 保険会社は、1暦年以内に売上を15%増やし、顧客維持を10%増や...
- 質問47 あなたは組織のビジネスアナリストであり、テクノロジーの問題に
- 質問48 ボブとスーザンは、彼らの組織のビジネスアナリストです。彼らは
- 質問49 次のステートメントのうち、誘発結果の確認プロセスの目的を最も
- 質問50 プロセスを改善するためのビジネス要件に取り組んでいる間、ビジ
- 質問51 ビジネスアナリスト(BA)は、アクセス管理システムの要件パッケ...
- 質問52 以下のすべては、どれを除いて転移リスク対応の例ですか?
- 質問53 マルチドメインプロジェクトには、さまざまな技術的背景を持つ利
- 質問54 メーカー0はメーカーKから合併提案を受けました。メーカーOの上...
- 質問55 潜在的なソリューションを採用する企業の能力を特定する一環とし
- 質問56 新しいのいくつかのプロトタイプを作成した後。Webベースのアプ...
- 質問57 次のすべての利害関係者は、どれを除いて要件の優先順位付けに参
- 質問58 花の会社は、従業員が自分の仕事に満足しているかどうかを判断す
- 質問59 プロジェクトのビジネス分析アプローチを定義する一環として、ビ
- 質問60 ビジネスアナリスト(BA)は、最近の変更イニシアチブのパフォー...
- 質問61 ソフトウェア開発会社は、顧客ベース向けの新製品を作成中です。
- 質問62 会社のヘルプデスクに関するアイデアや態度を特定するために、組
- 質問63 ビジネスアナリスト(BA)は、観察、ワークショップ、およびイン...
- 質問64 銀行は、運用上の使用のために、通貨をママのオフィスからトラン
- 質問65 ビジネスアナリスト(BA)は、ビジネス分析アプローチを定義し、...
- 質問66 次のうち、プロジェクトスコープの視覚的な分解はどれですか?
- 質問67 あなたは組織のビジネスアナリストであり、特定された問題に対し
- 質問68 プロジェクトの完了後、進行中の利害関係者のコラボレーションを
- 質問69 あなたの組織は、ビジネス分析に計画主導のアプローチを使用して
- 質問70 次のうち、プロジェクトスコープを作成、実行、監視、制御し、検
- 質問71 グローバル企業の国内支社は、PGA(Public and Government Affai...
- 質問72 あなたはTHY組織のビジネスアナリストであり、要件を収集しまし...
- 質問73 ソフトウェア開発会社は、顧客ベース向けの新製品を作成中です。
- 質問74 組織は、内部プロセスの効率を高めるためのソリューションを実装
- 質問75 現在のプロジェクトには50人の利害関係者がいます。このプロジェ...
- 質問76 あなたはあなたの組織のビジネスアナリストであり、行動誘発活動
- 質問77 プロジェクト作業の完全性を判断し、プロジェクトを前進させるた
- 質問78 ホリーは彼女の組織のビジネスアナリストです。経営陣はホリーに
- 質問79 企業は財務実績が低く、コーダーのビジネス戦略の多くの側面を変
- 質問80 高リスクで注目度の高いプロセスを自動化するプロジェクトのスポ
- 質問81 非営利の公益事業会社には900人の従業員がおり、その大部分は1時...
- 質問82 ビジネスアナリスト(BA)は、利害関係者と一緒に要件のサブセッ...
- 質問83 約1000の小売店にサービスを提供している地元のメーカーは、過去...
- 質問84 あなたはあなたの組織のビジネスアナリストです。過去数か月間、
- 質問85 サービスプロバイダーは利益率の大幅な低下を経験しているため、
- 質問86 ビジネスアナリスト(BA)は、いくつかの誘発活動を完了したばか...
- 質問87 SWOT分析のTはどういう意味ですか?
- 質問88 次のタスクのうち、他のタスクが完了するまで開始できないものは
- 質問89 プロジェクト実行の傾向を追跡するための品質管理図は次のうちど
- 質問90 要件のレビュー中に、実装主題専門家 (SME) が要件を特定しまし...
- 質問91 利害関係者の分析はいつ実行されますか?
- 質問92 ある会社にはプロセス改善イニシアチブがあり、年間150,000米ド...
- 質問93 あなたはNHQ組織のビジネスアナリストです。経営陣は、注文処理...
- 質問94 あなたはあなたの組織のビジネスアナリストです。現在のプロジェ
- 質問95 教訓文書はいつ更新されますか?
- 質問96 次のすべては、どれを除いて要件を指定またはモデル化するために
- 質問97 次の図のうち、感度分析データを表示するために使用されるのはど
- 質問98 ビジネスアナリスト(BA)は、鉄道チケットの起動システムの有効...
- 質問99 ビジネスアナリスト(BA)は、ガバナンスアプローチを準備してい...
- 質問100 組織内で提案されたソリューションのソリューションスコープを作
- 質問101 ビジネスアナリスト(BA)は、要件を確認、構造化、および整理し...
- 質問102 あなたは組織のビジネスアナリストであり、ビジネス分析アプロー
- 質問103 あなたは、要件がほとんどない小規模なプロジェクトのビジネスア
- 質問104 提案されたソリューションプロセスを評価するための入力は3つだ
- 質問105 利害関係者は、ソリューションで受け入れる意思のある不確実性の
- 質問106 チームは、ユーザー特権とアクセス制御システムに取り組んでいま
- 質問107 最近実装されたプロジェクトに取り組んでいるビジネス アナリス
- 質問108 ヘンリーは、UUH組織のビジネスアナリストです。現在、ヘンリー...
- 質問109 あなたは組織のビジネスアナリストであり、Billと協力してモデル...
- 質問110 あなたは組織のビジネスアナリストであり、組織のプロジェクトマ
- 質問111 次の図のどれが根本原因分析研究の結果を視覚化していますか?
- 質問112 レイチェルは自分の組織のビジネスケースを書いています。彼女が
- 質問113 あなたは組織のビジネスアナリストであり、要件の割り当てプロセ
- 質問114 ビジネスアナリスト(BA)は、以前の主要な実装で使用されたビジ...
- 質問115 次の要件属性のうち、あいまいな特性が欠けているものはどれです
- 質問116 ビジネスアナリスト(BA)は、新しい製品スケジューリングシステ...
- 質問117 エンタープライズ分析は、組織に多くのことを提供します。 次の
- 質問118 あなたは大規模で複雑なソルのビジネスアナリストですソリューシ
- 質問119 あなたはあなたの組織のビジネスアナリストです。プロジェクトの
- 質問120 革新的なピザレストランは、毎週新しいピザのトッピングを発表し
- 質問121 多国籍メーカーのビジネスユニットは、完全性が重要な機器の劣化
- 質問122 あなたは組織のビジネスアナリストであり、ビジネス分析の仕組み
- 質問123 プロジェクトの検査官が最初の成果物を承認するまで完了できない
- 質問124 本の自動販売機の製造を専門とする会社が10年の歴史を持っていま...
- 質問125 ビジネスアナリスト(BA)は、さまざまなレベルの製品専門知識を...
- 質問126 あなたは組織のビジネスアナリストであり、新しいビジネスチャン
- 質問127 プロジェクトの範囲の変更が評価され、新しく割り当てられたビジ
- 質問128 どの計画に、作業範囲の説明、成果物の作業分解図、活動リスト、
- 質問129 ビジネスアナリスト(BA)は最近、包括的な利害関係者分析を完了...
- 質問130 ビジネスアナリスト(BA)は、会社が実装を計画している変更の要...
- 質問131 BAは、クラス図に示されている要件を分析しています。ダイアグラ...
- 質問132 ある会社が別のチャネルで既存の製品を発売したいと考えており、
- 質問133 あなたは組織のビジネスアナリストであり、利害関係者と協力して
- 質問134 組織がリスク許容度を設定し、潜在的なリスクを特定し、リスクの
- 質問135 ビジネスアナリスト(BA)は、決済システム(PS)の実装に取り...
- 質問136 次のタイプの引き出しのうち、各利害関係者が特定のプロセスにお
- 質問137 あなたは組織のビジネスアナリストであり、バージニア州と協力し
- 質問138 ビジネスアナリスト(BA)は、ソリューションのさまざまなリリー...
- 質問139 次の手法のうち、リスクのある他の信頼できる情報源との調整とコ
- 質問140 次の役割のうち、プロジェクトスコープステートメント、フェーズ
- 質問141 新しい財務ソリューションの実装後、ビジネスアナリスト(BA)は...
- 質問142 ビジネスアナリスト(BA)は、決済システム(PS)の実装に取り...
- 質問143 あなたは、組織の大規模プロジェクトのビジネスアナリストです。
- 質問144 次のビジネス分析計画および監視手法のどれを使用して、ビジネス
- 質問145 ビジネスアナリスト(BA)は、既存の規制や契約に加えて、プロジ...
- 質問146 あなたは組織のビジネスアナリストであり、ソリューションスコー
- 質問147 ほとんどのソフトウェア開発プロジェクトで必須なのは次のうちど
- 質問148 次のプロセスのうち、セキュリティプログラムの成熟度を測定する
- 質問149 ビジネスアナリスト(BA)は、製品のセットアップ、販売、および...
- 質問150 バスマンアナリスト(BA)には、配達プロセスを改善するための新...
- 質問151 ビジネス分析のパフォーマンスプロセスの管理中に使用される手法
- 質問152 要件に合わせたモデルを作成しています。 ソリューションと直接
- 質問153 ビジネスアーキテクチャ、実現可能性調査、およびビジネスケース
- 質問154 オンライン株取引システムが導入されています。 次のイベントの
- 質問155 ビジネスアナリスト(BA)は、現在進行中のビジネス分析作業に関...
- 質問156 保険会社は、1暦年以内に売上を15%増やし、顧客維持を10%増や...
- 質問157 あなたはあなたの組織のビジネスアナリストです。現在、顧客がビ
- 質問158 グローバル企業の国内支社は、PGA(Public and Government Affai...
- 質問159 人気のある飲料の大手メーカーは、特定の地域にサービスを提供す
- 質問160 プロジェクト開発ライフサイクルの次のフェーズに進む前に、次の
- 質問161 保険会社は、1暦年以内に売上を15%増やし、顧客維持を10%増や...
- 質問162 大手ソフトウェア製造会社は、要件が効果的かつ効率的に管理され
- 質問163 あなたはあなたの組織のビジネスアナリストであり、ほぼから要件
- 質問164 多国籍メーカーのビジネスユニットは、完全性が重要な機器の劣化
- 質問165 ビジネスアナリスト(BA)が利害関係者に提示した溶質により、さ...
- 質問166 あなたは組織のビジネスアナリストであり、要件の優先順位付けに
- 質問167 プロジェクトに必要な作業の説明は次のうちどれですか?
- 質問168 計画事業分析活動への4つのインプットがあります。 次のうち、計...
- 質問169 BAは、武道組織で将来の状態の設計オプションに取り組んでいます...
- 質問170 次の役割のうち、プロジェクトチームと協力して成果物を理解し、
- 質問171 組織内で特定された問題の誘発プロセスの準備を完了しています。
- 質問172 ビジネスアナリスト(BA)は、今後の要件抽出会議に誰が参加すべ...
- 質問173 ビジネスアナリスト(BA)は、さまざまなソリューションの提案を...
- 質問174 サリーは彼女の組織のビジネスアナリストです。サリーと彼女のビ
- 質問175 ゲイリーは彼の組織のビジネスアナリストです。彼は、行動の利害
- 質問176 あなたはあなたの組織のビジネスアナリストであり、あなたの会社
- 質問177 監視および制御リスクの次の入力のうち、パフォーマンス測定から
- 質問178 あなたは、特定された問題の解決策を決定するために、複数のビジ
- 質問179 プロジェクトの進捗を示す時代を超越したイベントとは何ですか。
- 質問180 利害関係者グループ、コミュニケーションのニーズ、および要件に
- 質問181 人気のあるデパートチェーンは、今後2年間で、100店舗すべての収...
- 質問182 ビジネスアナリスト(BA)は、組織全体のさまざまなグループと協...
- 質問183 保険会社には、生命保険と損害保険の2つの保険数理チームがあり
- 質問184 要件の引き出しプロセスでは、ビジネスアナリストとチームが要件
- 質問185 将来の計画の基礎を提供するために、行動誘発活動のどの要素が追
- 質問186 ビジネスアナリスト(BA)は、顧客の問題に対する最初の連絡先解...
- 質問187 エンタープライズ分析を完了しています。経営陣は、提案されたプ
- 質問188 ビジネスアナリスト(BA)は、探索的分析の一環として、ビジネス...
- 質問189 新しいプロジェクトでは、中国、イタリア、ドイツ、米国、カナダ
- 質問190 要件の仕様とモデルが、さらなる作業をガイドするために効果的に
- 質問191 ビジネスアナリスト(BA)は、さまざまなリスク回避的な利害関係...
- 質問192 あなたはあなたの組織のビジネスアナリストです。要件の優先順位
- 質問193 プロジェクトは、予測アプローチを使用して実装されます。残念な
- 質問194 組織は、現在のプロセスを合理化して、パフォーマンスを向上させ
- 質問195 あなたはあなたの組織のビジネスアナリストです。経営陣は、提案
- 質問196 (Exhibit) 荷物追跡ソリューションに求められる付加価値に合わせ...
- 質問197 ビジネスアナリスト(BA)は、規制の厳しい政府機関と正式ではな...
- 質問198 ビジネスアナリスト(BA)は、利害関係者会議のスケジュールを立...
- 質問199 ビジネスアナリスト(BA)は、エンドユーザーのサービス要求を満...
- 質問200 セミナー管理者は、これら3つの図を確認し、BAに、研修生が通過...
- 質問201 ビジネスアナリスト(BA)は、ユーザー受け入れテスト中に欠陥を...
- 質問202 最近の展開の成功に続いて、ビジネスアナリスト(BA)は、要件の...
- 質問203 ベンダー選択の要件を完了しており、市販のソリューションの価格
- 質問204 ビジネスアナリスト(BA)は、ウォーターフォール手法からアジャ...
- 質問205 次のうち、要件優先順位付けセッション中の利害関係者による交渉
- 質問206 プロジェクトは複雑であるため、プロジェクトボードは、ビジネス
- 質問207 ビジネスアナリスト(BA)は、自動車保険商品の要件をドメインお...
- 質問208 次のうち、顧客が期待している成果物を定義しているのはどれです
- 質問209 ビジネスアナリスト(BA)は、プロジェクト中に発生した変更の意...
- 質問210 プロジェクトの進捗状況を測定するために使用されるプロジェクト
- 質問211 次のうちどれが、潜在的な自然および人為的な有害事象によって引
