有効的なPMP-JPN問題集はJPNTest.com提供され、PMP-JPN試験に合格することに役に立ちます!JPNTest.comは今最新PMP-JPN試験問題集を提供します。JPNTest.com PMP-JPN試験問題集はもう更新されました。ここでPMP-JPN問題集のテストエンジンを手に入れます。
PMP-JPN問題集最新版のアクセス
「1975問、30% ディスカウント、特別な割引コード:JPNshiken」
プロジェクトの計画セッション中に、プロジェクト チームは月次進捗レポートに含める必要な情報の選択について話し合いました。このレポートは実行フェーズ、監視フェーズ、制御フェーズで作成され、プロジェクトの進捗状況をクライアントに伝えるときに使用されます。 the left with the action on the right.

正解:
Explanation
A screenshot of a project schedule Description automatically generated
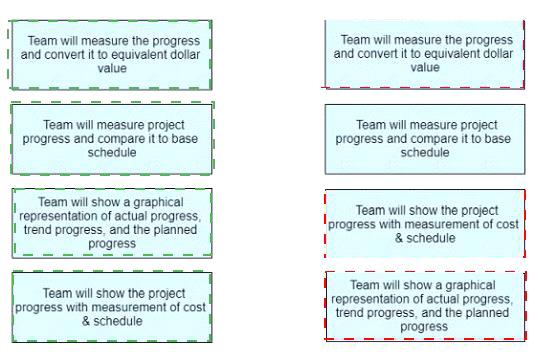
The correct answer is to match the scenario on the left with the action on the right as follows:
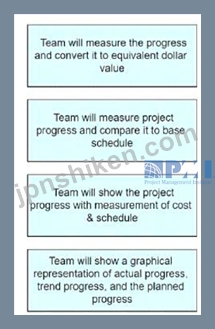
Team will measure the progress and convert it to equivalent dollar value -> Earned Value Analysis Team will measure project progress and compare it to base schedule -> Schedule Variance Team will show the project progress with measurement of cost & schedule -> Cost Performance Index and Schedule Performance Index Team will show a graphical representation of actual progress, trend progress, and the planned progress
-> S-Curve
Comprehensive and Detailed Explanation: According to the PMBOK Guide - Seventh Edition1, a monthly progress report is a type of performance report that provides information on the project's status, achievements, issues, and risks. It is used to communicate project progress to the client and other stakeholders, and to support decision making and corrective actions. A monthly progress report typically includes the following elements:
Project summary: A brief overview of the project's objectives, scope, deliverables, milestones, and key performance indicators (KPIs).
Project performance: A detailed analysis of the project's performance in terms of cost, schedule, quality, scope, and risks. This section may use various tools and techniques, such as:
Earned Value Analysis (EVA): A method to measure the project's progress and convert it to equivalent dollar value. It uses three key metrics: Planned Value (PV), Earned Value (EV), and Actual Cost (AC). EVA helps to determine the project's status, performance, and forecast.
Schedule Variance (SV): A measure of the difference between the planned and actual schedule of the project. It is calculated as SV = EV - PV. A positive SV indicates that the project is ahead of schedule, while a negative SV indicates that the project is behind schedule.
Cost Performance Index (CPI) and Schedule Performance Index (SPI): Two ratios that indicate how efficiently the project is using its resources and time. They are calculated as CPI = EV / AC and SPI = EV / PV. A CPI or SPI greater than 1 indicates that the project is performing better than planned, while a CPI or SPI less than 1 indicates that the project is performing worse than planned.
S-Curve: A graphical representation of the project's progress over time. It shows the cumulative values of PV, EV, and AC, and their trends and deviations. It helps to visualize the project's performance, status, and forecast.
Project issues and risks: A list of the current and potential issues and risks that affect the project, and their impact, probability, and mitigation strategies. This section may use a risk register or a risk matrix to document and prioritize the risks.
Project changes: A summary of the changes that occurred or are requested during the project, and their impact on the project's scope, cost, schedule, quality, and risks. This section may use a change log or a change request form to track and approve the changes.
Project action items: A list of the tasks or activities that need to be completed or followed up by the project team or stakeholders. This section may include the assignee, due date, status, and priority of each action item.
References: 1: PMBOK Guide - Seventh Edition | Project Management Institute

- 質問一覧「153問」
- 質問1 プロジェクト マネージャーが新しい部門に異動し、不慣れな領域
- 質問2 スクラム チームの毎日のミーティングは、それぞれ異なる国にあ
- 質問3 プロジェクト チームは、プロジェクトの範囲をどのように実現す
- 質問4 組織に初めて加わったプロジェクト マネージャーは、リソース不
- 質問5 プロジェクト マネージャーがプロジェクトの真っ最中に、プロジ
- 質問6 運用機能内でプロジェクトを実行しているときに、プロジェクト
- 質問7 チームメンバーは、ふりかえり中に議論された、別のチームメンバ
- 質問8 変更管理委員会 (CCB) は、対象分野の専門家 (SME) によって提出...
- 質問9 新しいソフトウェア ツールに取り組んでいるチーム メンバーの一...
- 質問10 プロジェクトの計画セッション中に、プロジェクト チームは月次
- 質問11 アジャイル チームの振り返り中に、プロジェクト チームのメンバ...
- 質問12 アジャイルなプロジェクト チームは、最初のイテレーションでは
- 質問13 情報技術 (IT) チームは、アジャイル開発チームが開発した製品の...
- 質問14 予定日までに納品しなければならないプロジェクトが、予期せぬリ
- 質問15 成果物のフォローアップ中に、チーム メンバーが他のチーム メン...
- 質問16 プロジェクト マネージャーが、会社の将来を決定する重要なプロ
- 質問17 ある企業は予測アプローチに従っており、製品の品質を評価する前
- 質問18 ある企業は、予測アプローチからアジャイルアプローチに移行して
- 質問19 ベンダーが複雑な製品を製造しました。工場の受け入れテスト中に
- 質問20 グローバル プログラムが開始され、さまざまな分散チームがイニ
- 質問21 ハイブリッド プロジェクトが展開されたばかりで、プロジェクト ...
- 質問22 ある企業は、自社のプロジェクトのために常に地元企業から非常に
- 質問23 プロジェクト スポンサーは、プロジェクト マネージャーに対し、...
- 質問24 プロジェクト マネージャーは、今後のプロジェクトに対して予測
- 質問25 ソフトウェア配信プロジェクトに技術的な障害が発生し始めました
- 質問26 企業の新しいコミュニケーション システムには、オンライン ダッ...
- 質問27 プロジェクト マネージャーは、要件が明確でなく、期限も予算も
- 質問28 プロダクト所有者はスプリント レビュー ミーティングに招待され...
- 質問29 アジャイル プロジェクトは 6 か月前に始まりました。プロジェク...
- 質問30 毎日のチェックイン ミーティングで、チーム メンバーは、使用す...
- 質問31 計画セッションの後、新しいプロジェクトが開始されました。この
- 質問32 中規模の資本プロジェクトでは、会社の契約部門からリソースを共
- 質問33 プロジェクト チームは、要件に関する技術的な詳細を理解するの
- 質問34 プロジェクト B のリーダーは、プロジェクト A のチーム メンバ...
- 質問35 プロジェクト マネージャーは、開発者チームのスクラム マスター...
- 質問36 プロジェクトの実施中に、プロジェクト チームは新しい機会を発
- 質問37 プロジェクト マネージャーは、新しいプロジェクトに関してプロ
- 質問38 プロジェクト チームは、A 国に拠点を置くメンバーと、12 時間の...
- 質問39 上級マネージャーとのプロジェクト状況会議中に、プロジェクト
- 質問40 プロジェクトでは、1 人のコア チーム メンバーがすべての作業を...
- 質問41 新しく設立されたアジャイル プロジェクトのスポンサーは、その
- 質問42 初期段階にあるガバナンス コンサルティング プロジェクトを主導...
- 質問43 イテレーションはほぼ完了していますが、チームはさらに時間がか
- 質問44 プロジェクト チームのメンバーが病気のため、数週間プロジェク
- 質問45 プロジェクトの実行中に、プロジェクト マネージャーは、完了時
- 質問46 地元企業は新製品を開発しており、機能のプログラミング作業に初
- 質問47 新しいスクラム チームのチーム メンバーは、これまで一緒に作業...
- 質問48 運送会社は、配送プロセスを改善するための新しいツールを開発し
- 質問49 プロジェクト チームは、既存のシステムを新しいシステムに置き
- 質問50 プロジェクト マネージャーは、プロジェクトの実行フェーズ中に
- 質問51 プロジェクトの実行途中で、利害関係者から調達予定の設備を要求
- 質問52 製品は最後の反復的な増分を行っており、プロジェクト チームは
- 質問53 プロジェクトの最後の 10% に計画よりも時間がかかる場合、アジ...
- 質問54 プロジェクト マネージャーがアジャイル プロジェクトを引き継ぎ...
- 質問55 ある企業は、アジャイル アプローチを使用してプロジェクトの管
- 質問56 クライアントとの毎週の状況会議で、プロジェクト マネージャー
- 質問57 最近、チームの主要メンバー数名がプロジェクト チームを去りま
- 質問58 プロジェクトの途中で引き継いだプロジェクト マネージャーは、
- 質問59 プロジェクト マネージャーは、プロジェクトの月次パフォーマン
- 質問60 プロジェクト チームは重要な成果物を顧客に提供しました。お客
- 質問61 製品チームは、複数年にわたるビジネス イニシアチブを実現する
- 質問62 上級プロジェクト マネージャーは、プロジェクト マネージャーの...
- 質問63 プロジェクトにはプロジェクト マネージャーが割り当てられます
- 質問64 プロジェクト管理オフィス (PMO) は、コストとスケジュールの両...
- 質問65 過去 7 日間のスプリントのこのバーンアップ チャートによると、...
- 質問66 チーム メンバーの 1 人は毎日のスタンドアップ ミーティングに...
- 質問67 プロジェクト マネージャーは、段階的に価値を提供する必要があ
- 質問68 プロジェクト マネージャーは、会社の CEO、スポンサー、チーム ...
- 質問69 ユーザー受け入れテスト中に、システムのパフォーマンスに重大な
- 質問70 最近、プロジェクト マネージャーが銀行の IT プロジェクトに割...
- 質問71 新しいデザインの立ち上げの最終段階で、チーム メンバーはデザ
- 質問72 IT 企業のプロジェクト マネージャーは、5 つの異なる国と 4 つ...
- 質問73 チームは数か月間プロジェクトに取り組んでいますが、新しい知識
- 質問74 プロジェクト マネージャーは、チーム メンバーがハイブリッド ...
- 質問75 プロジェクト マネージャーは、リソースがさまざまな場所に分散
- 質問76 高度に政治化された組織環境では、利害関係者はそれぞれの業務目
- 質問77 プロジェクト マネージャーは、新しいチーム メンバーのパフォー...
- 質問78 システムが運用開始されたら、チームは使用状況データを収集して
- 質問79 左側の対人スキルを右側の適切なシナリオにドラッグします。 (Ex...
- 質問80 チームメンバーはプロジェクトマネージャーと議論しています。前
- 質問81 組織は、複雑なプロジェクトに対してハイブリッド配信アプローチ
- 質問82 サプライヤーはプロジェクト マネージャーに、プロジェクトの主
- 質問83 プロジェクト マネージャーは、新興企業のプロジェクトに取り組
- 質問84 最近、プロジェクト マネージャーが既存のプロジェクトを引き継
- 質問85 プロジェクト マネージャーは、予測ライフサイクル プロジェクト...
- 質問86 プロジェクト マネージャーはソフトウェア開発プロジェクトを担
- 質問87 アジャイルなプロジェクト チームの上級メンバーが突然組織を辞
- 質問88 アジャイル プロジェクトのテスト チームのメンバーは、プロジェ...
- 質問89 プロジェクト マネージャーは、クロスカントリー パイプライン ...
- 質問90 複数の海外拠点を持つプロジェクトでは、遅延の傾向が指摘されて
- 質問91 プロジェクトは現在実行段階にあります。プロジェクトが複雑で、
- 質問92 数百万ドル規模のプロジェクトが開始され、実行段階にあります。
- 質問93 プロジェクトマネージャーは、長年使用されてきた製品を改造する
- 質問94 アジャイル プロジェクトでは、チームは 1 回の反復で 40 ストー...
- 質問95 プロジェクトの利害関係者は、すぐに怒り、プロジェクトに対して
- 質問96 顧客は、変更予定日の 1 日前に追加の変更を要求します。プロジ...
- 質問97 アジャイルなプロジェクト マネージャーは、チーム メンバーの 1...
- 質問98 技術の互換性を評価するための概念実証を提供するプロジェクトが
- 質問99 グローバル プロジェクトでは、プロジェクト マネージャーは、プ...
- 質問100 スプリント 2 日目の毎日のスタンドアップで、製品所有者は開発...
- 質問101 プロジェクト マネージャーは、大規模なグローバル プロジェクト...
- 質問102 クライアントは、プログラムステータスレポートのプロジェクトマ
- 質問103 プロジェクト チームのメンバーは、遅延の危険性があるプロジェ
- 質問104 プロジェクトでは、毎週の配送サイクルで大量の電源を入手する必
- 質問105 プロジェクト マネージャーは最近プロジェクトを引き継ぎました
- 質問106 アジャイル チームは 5 つのスプリントを完了しました。最終製品...
- 質問107 プロジェクト マネージャーは最近、重要なプロジェクトを主導す
- 質問108 チーム メンバーの 1 人が、前回の会議で交わされた合意について...
- 質問109 イテレーションベースのマーケティング プロジェクトでは、製品
- 質問110 アジャイル プロジェクト チームは、ロボットと接続する産業用シ...
- 質問111 運営委員が週報に不満を漏らしている。彼らは、報告書が長すぎて
- 質問112 エイチームはコミットされた仕事を提供していません。カンバン
- 質問113 経験豊富なプロジェクト マネージャーが、他のプロジェクトとい
- 質問114 企業のチーム能力開発計画の一環として、プロジェクト マネージ
- 質問115 組織は、多段階のプロジェクトを開始しようとしています。厳格な
- 質問116 複数の下請け業者がいる複雑なプロジェクトで、1 つの下請け業者...
- 質問117 最近、ある建設会社がケーブル橋の建設プロジェクトを落札した。
- 質問118 プロジェクト マネージャーは、既存の製品のメジャー アップグレ...
- 質問119 新しい建築プロジェクトはライフサイクルの途中にあります。自治
- 質問120 ハイブリッド プロジェクトの最後の反復中に、チームの主要メン
- 質問121 研究所は、固定リリース日で 8 回の反復で実行されるように定義...
- 質問122 ある銀行は、顧客向けに収益の増加にもつながる新しいサービスを
- 質問123 プロジェクトの実行中、プロジェクト マネージャーは、テスト キ...
- 質問124 プロジェクトの開始中にリスクが発生しました。サプライヤーは、
- 質問125 プロジェクト ゲート レビュー ミーティング中に、プロジェクト...
- 質問126 あるプロジェクト マネージャーは、クライアントとの作業で学ん
- 質問127 ある企業は、これまで不採算だった販売チャネルを廃止するプロジ
- 質問128 アジャイル プロジェクトの最初のリリース日が近づいており、製
- 質問129 プロジェクトの設計作業が予定より早く完了しました。突然、プロ
- 質問130 新しいチーム メンバーが、会社のイントラネット上にある組織プ
- 質問131 プロジェクト マネージャーが既存のプロジェクトに参加します。
- 質問132 プロジェクトの終了段階で、プロジェクト マネージャーは、クラ
- 質問133 設備の設置が遅れているため、プロジェクトが予定より遅れていま
- 質問134 プロジェクトは 6 回のうち 3 回目の反復を開始しています。計画...
- 質問135 ある企業は、既存の製品の 1 つを強化するプロジェクトを開始し...
- 質問136 プロジェクトマネージャーはプロジェクトの途中で任命されます。
- 質問137 プロジェクト マネージャーはプロジェクト利益管理計画を作成し
- 質問138 アジャイル プロジェクトは、8 回の反復のうち 7 回目を開始して...
- 質問139 銀行は、3つの近隣の都市の1つに別の支店を建設することを検討し...
- 質問140 コンプライアンス戦略は、プロジェクトの計画段階で作成されます
- 質問141 ある企業が本社を別の都市に移転します。この割り当てを担当する
- 質問142 プロジェクトの終了時に、プロジェクト マネージャーはプロジェ
- 質問143 最近プロジェクトが始まりました。プロジェクト マネージャーは
- 質問144 新しいプロジェクト マネージャーが、2 週間前に開始された進行...
- 質問145 コンピューター ゲーム会社で働くプロジェクト マネージャーは、...
- 質問146 プロジェクト マネージャーは、テクノロジー管理サービスを A 社...
- 質問147 多くのクライアントとチームメンバーがいる複雑な開発プロジェク
- 質問148 新製品発売のプロジェクトは非常に初期段階にあり、要件は進化し
- 質問149 医療組織は、医療コンプライアンスのニーズを確実に満たすために
- 質問150 プロジェクト マネージャーは、予測プロジェクト管理アプローチ
- 質問151 町民に大きな影響を与える大型公共事業をプロジェクトマネージャ
- 質問152 顧客は、プロジェクトマネージャーにビジネス価値を生み出す機会
- 質問153 新しい開発プロジェクトが始まろうとしていますが、プロジェクト
