- ホーム
- Microsoft
- PL-300J - Microsoft Power BI Data Analyst (PL-300日本語版)
- Microsoft.PL-300J.v2024-02-08.q148
- 質問36
有効的なPL-300J問題集はJPNTest.com提供され、PL-300J試験に合格することに役に立ちます!JPNTest.comは今最新PL-300J試験問題集を提供します。JPNTest.com PL-300J試験問題集はもう更新されました。ここでPL-300J問題集のテストエンジンを手に入れます。
PL-300J問題集最新版のアクセス
「515問、30% ディスカウント、特別な割引コード:JPNshiken」
次の展示に示されているビジュアルを含むレポートページがあります。

ドロップダウンメニューを使用して、図に示されている情報に基づいて各ステートメントを完了する回答の選択肢を選択します。注:正しい選択はそれぞれ1ポイントの価値があります。

ドロップダウンメニューを使用して、図に示されている情報に基づいて各ステートメントを完了する回答の選択肢を選択します。注:正しい選択はそれぞれ1ポイントの価値があります。
正解:

Explanation
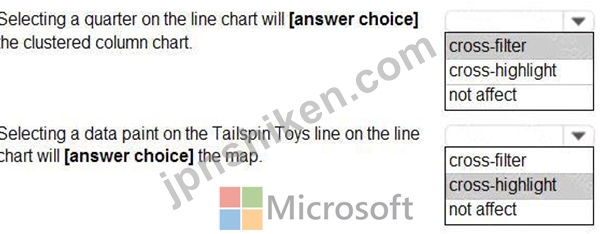
Box 1: cross-filter
By default, selecting a data point in one visual on a report page will cross-filter or cross-highlight the other visuals on the page.
Box 2: cross-highlight
Example:
By default, selecting a data point in one visual on a report page will cross-filter or cross-highlight the other visuals on the page.
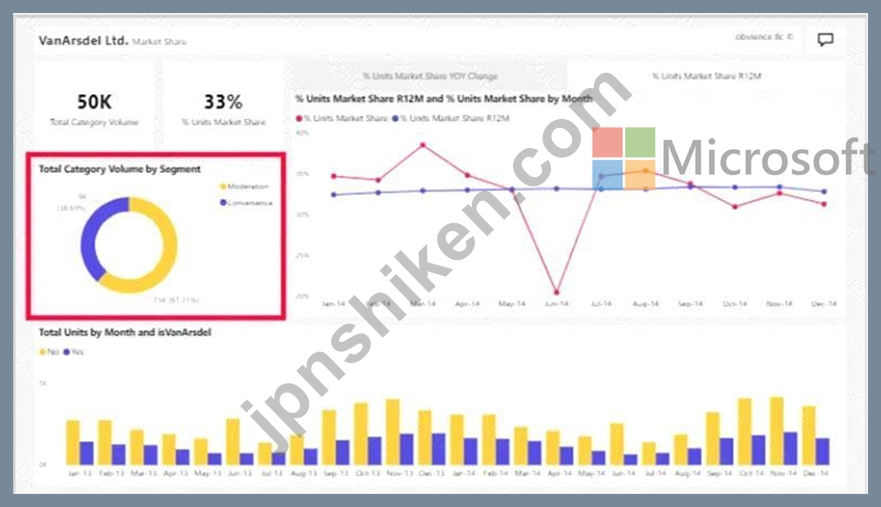
1. Let's see what happens when we select Moderation.
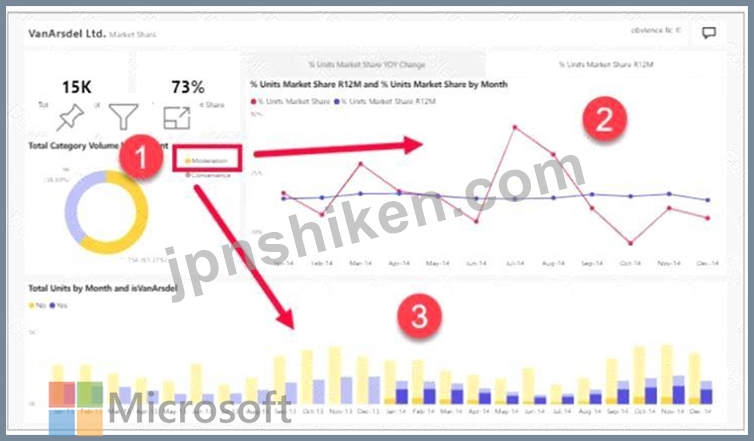
2. Cross-filtering removes data that doesn't apply. Selecting Moderation in the doughnut chart cross-filters the line chart. The line chart now only displays data points for the Moderation segment.
3. Cross-highlighting retains all the original data points but dims the portion that does not apply to your selection. Selecting Moderation in the doughnut chart cross-highlights the column chart. The column chart dims all the data that applies to the Convenience segment and highlights all the data that applies to the Moderation segment.
Reference:
https://docs.microsoft.com/en-us/power-bi/consumer/end-user-interactions

- 質問一覧「148問」
- 質問1 WorkspaceA と Workspaces という名前の 2 つの Power Bl ワーク...
- 質問2 あなたの会社は、Microsoft Power Blのデータセット、レポート、...
- 質問3 レポート要件に基づいて月を表示するには、計算列を作成する必要
- 質問4 ionには、TemperatureReadingsという名前のテーブルを含むPowerB...
- 質問5 マーケティング部門の Power Bl レポートがあります。このレポー...
- 質問6 Power BI Desktop で、3 つのページを含むレポートを作成してい...
- 質問7 注:この質問は、同じシナリオを提示する一連の質問の一部です。
- 質問8 遅延注文の割合を返すメジャーを作成する必要があります。 DAX式...
- 質問9 Microsoft Teams で完全にホストされているプロジェクト管理アプ...
- 質問10 次の表に示すデータを含む Microsoft Excel スプレッドシートが...
- 質問11 展示品に折れ線グラフが表示されています。([展示]タブをクリッ...
- 質問12 データセット、レポート、ダッシュボードを含むInventoryという...
- 質問13 ユーザーの苦情を含むCSVファイルがあります。このファイルには...
- 質問14 Orders、Date、Cityという名前の3つのテーブルを含むMicrosoftPo...
- 質問15 Power BI Desktop には、テーブルを含むデータセットがあります...
- 質問16 注:この質問は、同じシナリオを提示する一連の質問の一部です。
- 質問17 Azure SQL データベース データ ソースから dace テーブルと sal...
- 質問18 Date という名前のテーブルを含む Power B1 モデルがあります。...
- 質問19 次の表に示すデータセットをホストするPowerBIテナントがありま...
- 質問20 時間通りの配送レポートを作成する必要があります。 レポートに
- 質問21 次の展示に示すように、Transactionsという名前のクエリを表示し...
- 質問22 データ モデルは、次の分析をサポートする必要があります。 発注...
- 質問23 複数ページにわたる販売レポートを作成しています。各ページでは
- 質問24 次のテーブルを含むPowerBlデータセットをインポートします。 * ...
- 質問25 Power BIモデルには、CustomersとInvoiceという名前の2つのテー...
- 質問26 場所ごとの顧客数を表示する棒グラフを含むPowerBIレポートを作...
- 質問27 大きなデータセットをPowerQueryEditorにインポートします。 列...
- 質問28 次の展示に示すように、クイックメジャーを作成しています。 (Ex...
- 質問29 次の図に示すデータセットがあります。 (Exhibit) ビジュアルに...
- 質問30 注:この質問は、同じシナリオを提示する一連の質問の一部です。
- 質問31 注:この質問は、同じシナリオを提示する一連の質問の一部です。
- 質問32 You have a CSV file that contains user complaints. The file ...
- 質問33 You need to create a Power BI report. The first page of the ...
- 質問34 Azure SQL データベースには次の 3 つのバージョンがあります。 ...
- 質問35 Sales テーブルには、過去 5 年間から今日の日付までの日別の売...
- 質問36 次の展示に示されているビジュアルを含むレポートページがありま
- 質問37 元のダッシュボードの展示に示されているように、単一のレポート
- 質問38 注:この質問は、同じシナリオを提示する一連の質問の一部です。
- 質問39 会社の北西地域の販売地域の販売レポートをPowerBlで作成してい...
- 質問40 100を超える列を返すAPIがあります。以下は、列名のサンプルです...
- 質問41 注:この質問は、同じシナリオを使用する一連の質問の一部です。
- 質問42 顧客セグメントを分析するためのPowerBIレポートを作成していま...
- 質問43 MicrosoftPowerBlワークスペースがあります。 次の表に示すユー...
- 質問44 地域マネージャーのレポート要件を満たすには、Weekly_Returnsテ...
- 質問45 App1という名前のPowerBIアプリがあります。App1ワークスペース...
- 質問46 調達部門のPowerBiレポートがあります。レポートには、次の表の...
- 質問47 ページを含む Power Bl レポートがあります。このページには次の...
- 質問48 PowerQueryEditorで10,000行を生成するクエリを確認しています。...
- 質問49 エグゼクティブのビジュアルに必要な関係を作成する必要がありま
- 質問50 You receive annual sales data that must be included in Power...
- 質問51 次のデータを含む Power Bl モデルがあります。 (Exhibit) Date ...
- 質問52 レポートを作成して、営業チームがその業績と売上の推進要因を理
- 質問53 データセットのサイズを最小化する必要があります。ソリューショ
- 質問54 オリジナルの展示にビジュアルが表示されています。{[元の]タブ...
- 質問55 オンプレミスの Microsoft SQL Server データベースのデータを含...
- 質問56 ビジネスユニット、部門、および製品カテゴリのデータを一貫して
- 質問57 ドキュメントの配列を含むJSONファイルからデータセットを構築し...
- 質問58 3 ページを含む Power Bl レポートがあります。このページは、さ...
- 質問59 Salesという名前の単一ページのレポートを含むPowerBlワークスペ...
- 質問60 Note: This question is part of a series of questions that pr...
- 質問61 Power Query エディターを使用して、次の図に示されているデータ...
- 質問62 貸借対照表データを日付テーブルに関連付けることができるように
- 質問63 レポートの目標を達成するために貸借対照表レポートで使用できる
- 質問64 注:この質問は、同じシナリオを提示する一連の質問の一部です。
- 質問65 Purer 81 Desktop を Cassandra データベースに接続しようとして...
- 質問66 注: この質問は、同じシナリオを提示する一連の質問の一部です。...
- 質問67 Power BIサービスで、MicrosoftSQLServerデータベースからデータ...
- 質問68 ビジネスユニットアナリストへのアクセスを許可する必要がありま
- 質問69 次の展示に示すようなビジュアルを作成する必要があります。 (Ex...
- 質問70 Microsoft PowerBIDesktopを使用してレポートを作成します。 レ...
- 質問71 Power Query Editorを使用して、次のステップを作成します。 = T...
- 質問72 5 ページを含む Power Bl レポートがあります。 1 ~ 4 ページが...
- 質問73 ページを含む Power BI レポートがあります。このページには次の...
- 質問74 次の表に示すように、Microsoft Excel ワークシートにデータがあ...
- 質問75 PowerBlレポートを作成する必要があります。最初のページまたは...
- 質問76 学校への出席を分析するために、Power Bl データセットを作成す...
- 質問77 1,500行のデータを含む見込み顧客リストがあります a。リストに...
- 質問78 Sales、Product、およびDateという名前の3つのテーブルを含むMic...
- 質問79 次の図に示す権限を持つデータセットがあります。 ドロップダウ
- 質問80 DS1という名前のデータセットとRPT1という名前のレポートを含むW...
- 質問81 Power Bl レポートのデータ モデルを構築しています。次の表に示...
- 質問82 AzureBlobストレージ内の数十のフラットファイルから供給される...
- 質問83 Power Bl サービスを使用してダッシュボードを作成しています。 ...
- 質問84 5つの販売地域があります。各地域には1人の営業担当者が割り当て...
- 質問85 複数のダッシュボードがあります。 ユーザーがpowerbi.comから利...
- 質問86 複数のドキュメントライブラリを含むMicrosoftSharePointOnline...
- 質問87 ダッシュボード展示に Power Bi ダッシュボードが表示されていま...
- 質問88 Microsoft Power Bl レポートがあります。PBIX ファイルのサイズ...
- 質問89 ユーザーの苦情を含む CSV ファイルがあります。このファイルに...
- 質問90 冷蔵庫からの IoT 温度データ ストリーミングを表示する Power B...
- 質問91 注:この質問は、同じシナリオを提示する一連の質問の一部です。
- 質問92 会社の営業部門では、MicrosoftExcelからデータをインポートする...
- 質問93 Power BIモデルを管理するには、Salesとproductという名前のテー...
- 質問94 トップカスタマーレポートを作成する必要があります。 どのタイ
- 質問95 バスケット分析を実行するために、MicrosoftPowerBlでインポート...
- 質問96 在庫を分析するために Power 81 モデルを作成しています。 Date ...
- 質問97 Phone という名前の列を含むテーブルがあります。以下は、[電話]...
- 質問98 トランザクションという名前のテーブルから消費者の購入パターン
- 質問99 You have a Power BI imported dataset that contains the data ...
- 質問100 Population と Date という名前の 2 つのテーブルを含む Power B...
- 質問101 次の展示に示すように、PowerBIDesktopにレポートがあります。 (...
- 質問102 棒グラフと縦棒グラフを含むレポートがあります。棒グラフは、顧
- 質問103 同じテーブルと列を含む2つのAzureSQLデータベースがあります。 ...
- 質問104 100を超える公開されたデータセットがあります。 データセットの...
- 質問105 次の図に示す Power Bl データ モデルがあります。 (Exhibit) 選...
- 質問106 Sales、Customer、Date、Productという名前の4つのテーブルを含...
- 質問107 営業部門のレポート要件を満たすために何を作成する必要がありま
- 質問108 Salesという名前のテーブルを含むPowerBIモデルがあります。売上...
- 質問109 In Power Query Editor, you have three queries named ProductC...
- 質問110 データモデルを作成する前に、データの懸念に対処する必要があり
- 質問111 次の表に示すテーブルを含むデータベースから、顧客のトランザク
- 質問112 Power Bi Desktop を使用して Azure SQL データベースに接続して...
- 質問113 PowerBIレポートをMicrosoftSharePointOnlineページに埋め込みま...
- 質問114 あなたは会社の人事部門向けのレポートのコレクションを持ってい
- 質問115 BI Finance という名前のデータセットを含む BI Data という名前...
- 質問116 次の図に示すダッシュボードがあります。 (Exhibit) 次の図のよ...
- 質問117 注:この質問は、同じシナリオを提示する一連の質問の一部です。
- 質問118 冷蔵庫からストリーミングされる 10T の温度データを表示する Po...
- 質問119 営業マネージャーに必要なアクセスを提供するためのソリューショ
- 質問120 Products と Sales という名前の 2 つのテーブルを含む Power B1...
- 質問121 注:この質問は、同じシナリオを提示する一連の質問の一部です。
- 質問122 ビジネスインテリジェンス(Bl)開発者は、DirectQueryを使用し...
- 質問123 データセットを含むPowerBlワークスペースがあります。レポート...
- 質問124 Power 61デスクトップから、新しいデータセットを公開し、PowerB...
- 質問125 次の資料に示す Power BI データ モデルがあります。 (Exhibit) ...
- 質問126 次の表に示すテーブルを含む販売システムがあります。 (Exhibit)...
- 質問127 時間通りの配送レポートを作成する必要があります。レポートには
- 質問128 Power BIサービスでは、複数のダッシュボードを含むアプリワーク...
- 質問129 MicrosoftOneDriveフォルダーにMicrosoftExcelファイルがありま...
- 質問130 あなたの会社は、Microsoft Power BIのデータセット、レポート、...
- 質問131 注:この質問は、同じシナリオを提示する一連の質問の一部です。
- 質問132 PowerBIDesktopでレポートを作成しています。モデルには次の表が...
- 質問133 データセットをpowerbi.comに公開します。 次の各ステートメント...
- 質問134 What should you do to address the existing environment data ...
- 質問135 トップカスタマーレポートを作成する必要があります。 どのタイ
- 質問136 複数のダッシュボードがあります。 ユーザーがpowerbi.comから利...
- 質問137 次の表に示す表があります。 (Exhibit) インプレッションテーブ...
- 質問138 会社の売上のさまざまな視覚化を表示するPowerBIダッシュボード...
- 質問139 Power BIReportServer用に最適化されたPowerBIDesktopを使用して...
- 質問140 ReportA という名前の Power B1 レポートがあります。 ユーザー...
- 質問141 注:この質問は、同じシナリオを提示する一連の質問の一部です。
- 質問142 ある部門の従業員数を時系列で示す折れ線グラフがあります。 デ
- 質問143 AzureSQLデータベースから複数のテーブルをインポートするPBiXフ...
- 質問144 Note: This question is part of a series of questions that pr...
- 質問145 100 個の CSV ファイルを含むフォルダーがあります。 Power Bi ...
- 質問146 注: この質問は、同じシナリオを示す一連の質問の一部です。この...
- 質問147 縦棒グラフの視覚化を作成しています。 グループの展示に示され
- 質問148 CustomerとAddressという名前の2つのMicrosoftExcelテーブルをPo...
