- ホーム
- Microsoft
- SC-300 - Microsoft Identity and Access Administrator
- Microsoft.SC-300.v2026-04-11.q349
- 質問61
有効的なSC-300問題集はJPNTest.com提供され、SC-300試験に合格することに役に立ちます!JPNTest.comは今最新SC-300試験問題集を提供します。JPNTest.com SC-300試験問題集はもう更新されました。ここでSC-300問題集のテストエンジンを手に入れます。
SC-300問題集最新版のアクセス
「398問、30% ディスカウント、特別な割引コード:JPNshiken」
Azure サブスクリプションをお持ちです。
Azure AD ログは Log Analytics ワークスペースに送信されます。
ログをクエリし、ユーザーごとのサインイン数をグラフで表示する必要があります。
クエリをどのように完了すればよいですか? 回答するには、回答領域で適切なオプションを選択してください。
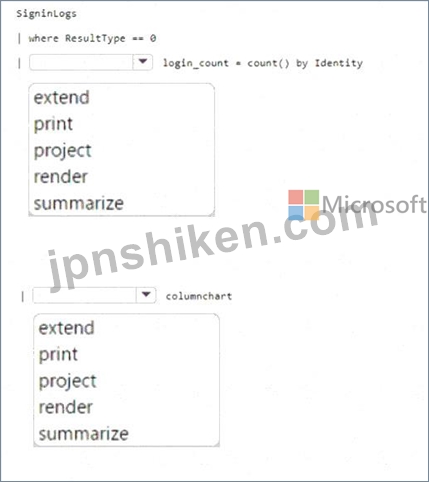
Azure AD ログは Log Analytics ワークスペースに送信されます。
ログをクエリし、ユーザーごとのサインイン数をグラフで表示する必要があります。
クエリをどのように完了すればよいですか? 回答するには、回答領域で適切なオプションを選択してください。
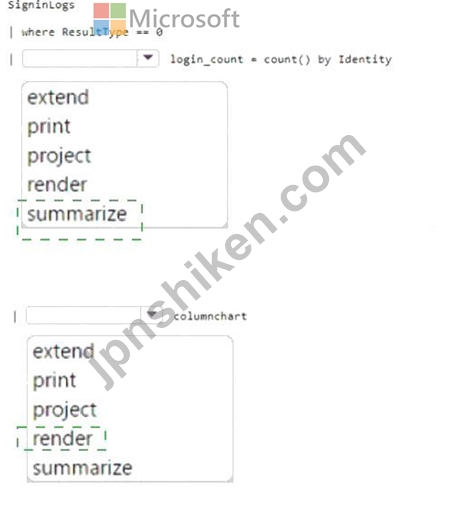
正解:
Explanation:
ボックス1
サインインログ
| ResultType == 0 の場合
| login_count = count() を ID 別に集計する
| 円グラフをレンダリングする
This query retrieves the sign-in logs, filters the successful sign-ins,summarizesthe count of sign-ins per user, and renders the result as a pie chart.
Box 2 = Render

- 質問一覧「349問」
- 質問1 会社には contoso.com という名前の Azure Active Directory (Az...
- 質問2 タスク10 Auditというグループを作成する必要があります。ソリュ...
- 質問3 You have a Microsoft 365 tenant and an Active Directory doma...
- 質問4 次の表に示すユーザーを含む Microsoft Entra テナントがありま...
- 質問5 Package1 という名前のアクセス パッケージと User1 という名前...
- 質問6 次の表に示すユーザーを含む Azure Active Directory (Azure AD)...
- 質問7 次の表に示すオブジェクトを含む Azure Active Directory (Azure...
- 質問8 ホットスポットに関する質問 次の表に示すキー コンテナーを含む...
- 質問9 contoso.com という Microsoft Entra テナントにリンクされた Az...
- 質問10 注: この質問は、同じシナリオを提示する一連の質問の一部です。...
- 質問11 You need to configure app registration in Azure AD to meet t...
- 質問12 Case Study 1 - Contoso, Ltd Overview Contoso, Ltd. is a cons...
- 質問13 User1 という名前のユーザーが含まれる Sub1 という名前の Azure...
- 質問14 委任要件を満たすには、Azure AD でアプリの登録を構成する必要...
- 質問15 User1 というユーザーが、次の誤ったパスワードを入力してテナン...
- 質問16 次の表に示すリソースを含む Azure サブスクリプションがありま...
- 質問17 A Datumユーザー向けのライセンスを特定する必要があります。ソ...
- 質問18 You need to configure app registration in Azure AD to meet t...
- 質問19 ネットワークには、contoso.com というオンプレミスの Active Di...
- 質問20 注: この質問は、同じシナリオを提示する一連の質問の一部です。...
- 質問21 You have an Azure subscription that contains the resources s...
- 質問22 ネットワークには、Azure AD Connect を使用して contoso.com と...
- 質問23 You have a Microsoft 365 tenant and an Active Directory doma...
- 質問24 storage1 という名前のストレージ アカウントと WebApp1 という...
- 質問25 SSPR の計画された変更を実装します。 User3 が SSPR を使用しよ...
- 質問26 You have a Microsoft Entra tenant. You configure self-servic...
- 質問27 Group1 と Group2 という 2 つのグループと、次の表に示すユーザ...
- 質問28 Microsoft 365 テナントがあります。 条件付きアクセス ポリシー...
- 質問29 委任要件を満たすには、Azure AD でアプリの登録を構成する必要...
- 質問30 Azure Active Directory Premium Plan 2 ライセンスを持つ Azure...
- 質問31 You have a Microsoft 365 E5 subscription. You create an acce...
- 質問32 Groups1、Group2、Group3 という 3 つのグループと、次の表に示...
- 質問33 Azure AD テナントと、App1 という名前の Azure Web アプリがあ...
- 質問34 contoso.com という名前の Microsoft 365 テナントがあります。 ...
- 質問35 Azure Monitor を使用して、Azure Active Directory (Azure AD) ...
- 質問36 contoso.com の SMTP アドレス スペースを使用する Microsoft Ex...
- 質問37 AzureサブスクリプションにUser1というユーザーが登録されていま...
- 質問38 オンプレミスネットワークには、Azure AD Connect を使用して Az...
- 質問39 You have an Azure AD tenant that contains two users named Us...
- 質問40 次の表に示すユーザーを含む Azure AD テナントがあります。 (Ex...
- 質問41 Your company has an Azure Active Directory (Azure AD) tenant...
- 質問42 次の表に示すカスタム ロールを含む Azure サブスクリプションが...
- 質問43 次の表に示すキー コンテナーを含む Azure サブスクリプションが...
- 質問44 ドラッグアンドドロップの質問 ネットワークには、Azure AD Conn...
- 質問45 You have an Azure Active Directory (Azure AD) tenant that ha...
- 質問46 会社には Microsoft 365 テナントがあります。 この会社には300...
- 質問47 contoso.com という Microsoft Entra テナントにリンクされた Az...
- 質問48 ドラッグアンドドロップの質問 オンプレミスネットワークには、A...
- 質問49 Microsoft Defender for Cloud Apps および Yammer を使用する M...
- 質問50 Microsoft 365 E5 テナントがあります。 App1 という名前のクラ...
- 質問51 contoso.com という名前の Azure AD テナントがあり、ゲスト用の...
- 質問52 User1 という名前のユーザーを含む Azure Active Directory (Azu...
- 質問53 会社では、2 つの新しい Microsoft 365 ES サブスクリプションと...
- 質問54 マーケティング部門の計画された変更と技術要件を実装する必要が
- 質問55 You have a Microsoft 365 tenant that contains a group named ...
- 質問56 クラウドベースのエンタープライズ アプリを含む Azure Active D...
- 質問57 セキュリティの既定値が無効になっている Azure Active Director...
- 質問58 図に示すように、Azure Active Directory (Azure AD) パスワード...
- 質問59 次の表に示すユーザーを含む Azure AD テナントがあります。 (Ex...
- 質問60 ネットワークには、Azure Active Directory (Azure AD) テナント...
- 質問61 Azure サブスクリプションをお持ちです。 Azure AD ログは Log A...
- 質問62 Microsoft 365 E5 テナントがあります。 App1 という名前のクラ...
- 質問63 User1 という名前のユーザーと Vault1 という名前の Azure Key V...
- 質問64 contoso.com と fabrikam.com という 2 つの Microsoft Entra テ...
- 質問65 認証要件を満たすには、パスワード制限を実装する必要があります
- 質問66 You have an Azure subscription that contains the key vaults ...
- 質問67 役割の割り当てを管理するために使用する役割を特定する必要があ
- 質問68 Log Analytics ワークスペースを作成します。 監査の技術要件を...
- 質問69 次の図に示すように、ユーザー管理者ロールの Azure AD Privileg...
- 質問70 次の表に示すユーザーを含む Azure AD テナントがあります。 (Ex...
- 質問71 注: この質問は、同じシナリオを提示する一連の質問の一部です。...
- 質問72 タスク3 LinkedlnアプリケーションをSales and Marketingアクセ...
- 質問73 You have an Azure Active Directory (Azure AD) tenant that ha...
- 質問74 Your network contains an on-premises Active Directory domain...
- 質問75 Azure Active Directory (Azure AD) テナントに、User1、User2、...
- 質問76 ケーススタディ2 - Litware, Inc. 概要 Litware, Inc. は、Fabri...
- 質問77 You have a Microsoft Entra tenant. You need to ensure that o...
- 質問78 Microsoft 365 テナントと、adatum.com という名前の Active Dir...
- 質問79 Your network contains an Active Directory forest named conto...
- 質問80 App1 という名前の Web アプリが含まれる Microsoft 365 E5 サブ...
- 質問81 次の表に示すリソースを含む Azure サブスクリプションがありま...
- 質問82 Group1 の図に示すように、Group1 という名前のグループを含む M...
- 質問83 会社には Microsoft 365 テナントがあります。 この会社には300...
- 質問84 Microsoft 365 E5 サブスクリプションがあり、そこには User1 と...
- 質問85 ユーザー ID が侵害される可能性に関する技術要件を満たす必要が...
- 質問86 Azure Monitor を使用して、Azure Active Directory (Azure AD) ...
- 質問87 ケーススタディ 1 - Contoso 社 概要 Contoso 社は、モントリオ...
- 質問88 Litware ユーザーへの Azure AD ライセンスの割り当てを構成する...
- 質問89 会社には contoso.com という名前の Azure Active Directory (Az...
- 質問90 You have an Azure AD tenant that contains the users shown in...
- 質問91 ネットワークには、Azure AD Connect を使用して contoso.com と...
- 質問92 Department1 という名前の管理単位を含む Azure Active Director...
- 質問93 Azure Active Directory Premium Plan 2 ライセンスを持つ Azure...
- 質問94 ネットワークには、contoso.com というオンプレミスの Active Di...
- 質問95 Group1 の図に示すように、Group1 という名前のグループを含む M...
- 質問96 You have an Azure Active Directory (Azure AD) tenant that co...
- 質問97 Microsoft 36S テナントがあります。 高リスク国のリストを含む...
- 質問98 次の表に示すユーザーを含む Azure AD テナントがあります。 (Ex...
- 質問99 次の仮想マシンが含まれる Azure サブスクリプションがあります...
- 質問100 You have an Azure AD tenant that contains the users shown in...
- 質問101 Azure サブスクリプションをお持ちです。このサブスクリプション...
- 質問102 Azure Active Directory (Azure AD) テナントがあります。 セル...
- 質問103 User1 にはユーザー管理者ロールが割り当てられています。 次の...
- 質問104 Sub1 ilia1 というAzureサブスクリプションがあり、そこには sto...
- 質問105 Microsoft Entra テナントにリンクされた Azure サブスクリプシ...
- 質問106 Appl という名前のエンタープライズ アプリケーションを含む con...
- 質問107 Azure サブスクリプションをお持ちです。 Azure AD ログは Log A...
- 質問108 Azure サブスクリプションをお持ちです。 Role1とRole2という2つ...
- 質問109 次の表に示すオブジェクトを含む Azure Active Directory (Azure...
- 質問110 You have a Microsoft 365 tenant. In Microsoft Entra ID, you ...
- 質問111 Azure Active Directory (Azure AD) に登録されている、App1 と...
- 質問112 注: この質問は、同じシナリオを提示する一連の質問の一部です。...
- 質問113 多要素認証 (MFA) が有効になっている Azure Active Directory (...
- 質問114 次の表に示すホストを含むオンプレミス データセンターがあ
- 質問115 ヘルプデスク管理者によるライセンス管理の技術要件を満たす必要
- 質問116 管理要件を満たすには、LWGroup1 グループを作成する必要があり...
- 質問117 Your network contains an on-premises Active Directory domain...
- 質問118 contoso.com の SMTP アドレス スペースを使用するオンプレミス...
- 質問119 Microsoft 36S テナントがあります。 高リスク国のリストを含む...
- 質問120 You have an Azure AD tenant named contoso.com that contains ...
- 質問121 ネットワークには、Azure AD Connect を使用して contoso.com と...
- 質問122 ホットスポットに関する質問 Azure Active Directory (Azure AD)...
- 質問123 Appl というオンプレミスアプリがあります。Microsoft Entra テ...
- 質問124 次の表に示すカスタム ロールを含む Azure サブスクリプションが...
- 質問125 Group3 という名前のグループと Department1 という名前の管理単...
- 質問126 委任要件を満たすには、Azure AD でアプリの登録を構成する必要...
- 質問127 Microsoft 365 E5 サブスクリプションをお持ちです。 ユーザー ...
- 質問128 ネットワークには、Azure AD Connect を使用して contoso.com と...
- 質問129 contoso.com の SMTP アドレス スペースを使用する Microsoft Ex...
- 質問130 ケーススタディ2 - Litware, Inc. 概要 Litware, Inc. は、Fabri...
- 質問131 Microsoft 365 テナントと、adatum.com という名前の Active Dir...
- 質問132 あなたの会社には、Contoso East と Contoso West という2つの部...
- 質問133 Sub1 という名前の Azure サブスクリプションがあります。 Micro...
- 質問134 contoso.com という Microsoft Entra テナントにリンクされた Az...
- 質問135 次の表に示すユーザーを含む Azure AD テナントがあります。 (Ex...
- 質問136 Microsoft 365 E5 サブスクリプションをお持ちの場合、以下のタ...
- 質問137 ネットワークには、Microsoft Entra Connect を使用して Microso...
- 質問138 次の表に示すユーザーを含む Azure Active Directory (Azure AD)...
- 質問139 Active Directory ドメインと同期する Azure Active Directory (...
- 質問140 会社には contoso.com という名前の Azure Active Directory (Az...
- 質問141 次の表に示すユーザーを含むハイブリッド Microsoft 365 サブス...
- 質問142 次の表に示すユーザーを含む Azure AD テナントがあります。 (Ex...
- 質問143 ネットワークには、Azure Active Directory (Azure AD) テナント...
- 質問144 User1 というユーザーが、次の誤ったパスワードを入力してテナン...
- 質問145 Microsoft 365 E5 サブスクリプションと Azure サブスクリプショ...
- 質問146 Sub1 という Azure サブスクリプションがあり、そこには RG1 と ...
- 質問147 会社には contoso.com という名前の Azure Active Directory (Az...
- 質問148 You have a Microsoft Entra tenant that contains the users sh...
- 質問149 ボストンオフィスから接続するユーザーに対して、MFA設定を構成...
- 質問150 Group3 という名前のグループと Department1 という名前の管理単...
- 質問151 Microsoft 365 テナントがあります。 条件付きアクセス ポリシー...
- 質問152 ホットスポットに関する質問 contoso.com と fabrikam.com とい...
- 質問153 Microsoft 36S テナントがあります。 高リスク国のリストを含む...
- 質問154 Azure AD テナントと、App1 という名前の Azure Web アプリがあ...
- 質問155 contoso.onmicrosoft.com というドメイン名を使用する新しい Mic...
- 質問156 組織データへのアプリケーションアクセスに関して計画されている
- 質問157 次の表に示すユーザーを含むハイブリッド Microsoft 365 サブス...
- 質問158 contoso.conmicrosoft.com というドメイン名を使用する新しい Mi...
- 質問159 次の表に示すユーザーを含む Microsoft 365 E5 サブスクリプショ...
- 質問160 次の表に示すホストを含むオンプレミス データセンターがあ
- 質問161 次の表に示すグループを含む Azure Active Directory (Azure AD)...
- 質問162 次の表に示すユーザーを含む Microsoft 365 E5 サブスクリプショ...
- 質問163 Your network contains an on-premises Active Directory Domain...
- 質問164 Microsoft 365 テナントがあります。 Azure Active Directory (A...
- 質問165 ケーススタディ 1 - Contoso 社 概要 Contoso 社は、モントリオ...
- 質問166 ネットワークには、Azure Active Directory (Azure AD) テナント...
- 質問167 Microsoft 365 E5 サブスクリプションと Azure サブスクリプショ...
- 質問168 次の表に示すリソースを含む Azure サブスクリプションがありま...
- 質問169 会社には Microsoft 365 テナントがあります。 すべてのユーザー...
- 質問170 最近のセキュリティ インシデントの問題を解決する必要がありま
- 質問171 次の表に示すグループを含む Azure AD テナントがあります。 (Ex...
- 質問172 You have a Microsoft 365 E5 subscription. You need to create...
- 質問173 You need to meet the technical requirements for the probabil...
- 質問174 マーケティング部門の計画された変更と技術要件を実装する必要が
- 質問175 User1 という名前のユーザーを含む contoso.com という名前の Az...
- 質問176 contoso.com の SMTP アドレス スペースを使用するオンプレミス...
- 質問177 Azure Active Directory (Azure AD) テナントがあります。 リス...
- 質問178 注: この質問は、同じシナリオを提示する一連の質問の一部です。...
- 質問179 クラウドベースのエンタープライズ アプリを含む Azure Active D...
- 質問180 次の表に示すユーザーを含む Azure AD テナントがあります。 (Ex...
- 質問181 User1 という名前のユーザーを含む Microsoft Entra テナントが...
- 質問182 Automation1 という名前の Azure Automation アカウントと、Vaul...
- 質問183 Microsoft 365 E5 サブスクリプションがあり、そこには User1 と...
- 質問184 次の表に示すユーザーを含む Microsoft Entra テナントがありま...
- 質問185 次の表に示すカスタム ロールを含む Azure サブスクリプションが...
- 質問186 You have an on-premises datacenter that contains the hosts s...
- 質問187 役割の割り当てを管理するために使用する役割を特定する必要があ
- 質問188 条件付きアクセス ポリシーを使用する Azure Active Directory (...
- 質問189 次の表に示すグループを含む Azure AD テナントがあります。 (Ex...
- 質問190 管理要件を満たすには、LWGroup1 グループを作成する必要があり...
- 質問191 Contoso という Azure Active Directory (Azure AD) テナントが...
- 質問192 Microsoft 365 E5 サブスクリプションがあり、そこには User1、U...
- 質問193 User1 という名前のユーザーを含む Azure AD テナントがあります...
- 質問194 User1 という名前のユーザーを含む Microsoft Entra テナントが...
- 質問195 App1 という名前の Web アプリが含まれる Microsoft 365 E5 サブ...
- 質問196 次の表に示すホストを含むオンプレミス データセンターがあ
- 質問197 会社では、ユーザーが企業のアプリケーションにアクセスする前に
- 質問198 次のクラウド プラットフォームのアカウントがあります。 * アズ...
- 質問199 Azure AD テナントがあります。 Azure AD Privileged Identity M...
- 質問200 ホットスポットに関する質問 Sub1 という名前の Azure サブスク...
- 質問201 シミュレーション 必要に応じて次のログイン資格情報を使用しま
- 質問202 Microsoft 365 E5 サブスクリプションをお持ちの場合、以下のタ...
- 質問203 You have an Azure Active Directory (Azure AD) tenant that ha...
- 質問204 Automation1 という名前の Azure Automation アカウントと、Vaul...
- 質問205 You have a Microsoft 365 subscription that is onboarded to M...
- 質問206 Your company has an Azure Active Directory (Azure AD) tenant...
- 質問207 You have an Azure subscription that contains the key vaults ...
- 質問208 あなたの会社には、contoso.com という Azure Active Directory ...
- 質問209 You have an Azure Active Directory (Azure AD) tenant that co...
- 質問210 Microsoft 365 E5 サブスクリプションと Azure サブスクリプショ...
- 質問211 次の表に示すユーザーを含む Azure Active Directory (Azure AD)...
- 質問212 デフォルトのアプリ登録設定を持つAzure Active Directory (Azur...
- 質問213 Azure サブスクリプションをお持ちです。 Azure AD ログは Log A...
- 質問214 次の表に示すユーザーを含む Azure AD テナントがあります。 (Ex...
- 質問215 1,000人のユーザーを含むMicrosoft Entraテナントがあり、ユーザ...
- 質問216 シミュレーション 必要に応じて次のログイン資格情報を使用しま
- 質問217 ネットワークには、Azure Active Directory (Azure AD) テナント...
- 質問218 ネットワークには、contoso.com というオンプレミスの Active Di...
- 質問219 Microsoft 36S サブスクリプションをご利用です。このサブスクリ...
- 質問220 あなたの会社には、contoso.com という Azure Active Directory ...
- 質問221 Site1 という名前の Microsoft SharePoint Online サイトを含む ...
- 質問222 Microsoft 365 E5 サブスクリプションがあり、そこには User1、U...
- 質問223 You need to implement the planned changes and technical requ...
- 質問224 次の表に示すオブジェクトを含む Azure Active Directory (Azure...
- 質問225 次の表に示すキー コンテナーを含む Azure サブスクリプションが...
- 質問226 You need to configure the detection of multi-staged attacks ...
- 質問227 Microsoft 365 E5 サブスクリプションをお持ちです。 ユーザー ...
- 質問228 You have an Azure Active Directory (Azure AD) tenant that co...
- 質問229 次の表に示すリソースを含む Azure サブスクリプションがありま...
- 質問230 Microsoft 36S テナントがあります。 高リスク国のリストを含む...
- 質問231 Microsoft 365 テナントがあります。 すべてのユーザーは携帯電...
- 質問232 Microsoft 365 E5 テナントがあります。 App1 という名前のクラ...
- 質問233 VM1 という名前の仮想マシンを含む Azure サブスクリプションが...
- 質問234 次の表に示すユーザーを含む Microsoft Entra テナントがありま...
- 質問235 次のグループを含む Azure Active Directory (Azure AD) テナン...
- 質問236 Site1 という名前の Microsoft SharePoint Online サイトと Grou...
- 質問237 貴社では、Azure AD ユーザーのパスワードに関するセキュリティ...
- 質問238 技術要件を満たすために、ユーザー管理者ロールの設定を変更する
- 質問239 Microsoft 365 E5 サブスクリプションがあり、そこには User1、U...
- 質問240 次の表に示すユーザーを含む Azure Active Directory (Azure AD)...
- 質問241 Microsoft 365 テナントがあります。 ユーザーは、Microsoft 365...
- 質問242 Microsoft 365 テナントがあります。 資格情報が漏洩したユーザ...
- 質問243 ネットワークには、Azure AD と同期し、次の表に示すユーザーを...
- 質問244 Microsoft 365 E5 サブスクリプションと Azure サブスクリプショ...
- 質問245 Sub1 という名前の Azure サブスクリプションがあり、そこには U...
- 質問246 Azure Active Directory (Azure AD) のパスワード保護は、図に示...
- 質問247 Microsoft 365 E5 サブスクリプションがあり、そこには User1、U...
- 質問248 次の表に示すユーザーを含む Azure Ad テナントがあります。 (Ex...
- 質問249 次の表に示すグループを含む Microsoft 365 E5 サブスクリプショ...
- 質問250 次の表に示すユーザーを含む Microsoft Entra テナントがありま...
- 質問251 ユーザー ID が侵害される可能性に関する技術要件を満たす必要が...
- 質問252 あなたの会社には、contoso.com という Azure Active Directory ...
- 質問253 次の表に示すリソースを含む Azure サブスクリプションがありま...
- 質問254 次の表に示すユーザーを含む Azure AD テナントがあります。 (Ex...
- 質問255 contoso.com の SMTP アドレス スペースを使用するオンプレミス...
- 質問256 Sub1 ilia1 というAzureサブスクリプションがあり、そこには sto...
- 質問257 Sub1 という Azure サブスクリプションがあり、そこには RG1 と ...
- 質問258 Department1 という名前の管理単位を含む Azure Active Director...
- 質問259 認証要件を満たすには、パスワード制限を実装する必要があります
- 質問260 会社では、2 つの新しい Microsoft 365 ES サブスクリプションと...
- 質問261 Package1 という名前のアクセス パッケージと User1 という名前...
- 質問262 次の表に示すユーザーを含む Azure Active Directory (Azure AD)...
- 質問263 ホットスポットに関する質問 Azure サブスクリプションをお持ち...
- 質問264 Case Study 3 - A. Datum Corp Overview A Datum Corporation is...
- 質問265 計画された変更をサポートし、MFA の技術要件を満たす必要があり...
- 質問266 User1 という名前のユーザーと、次の表に示すグループを含む Azu...
- 質問267 次の表に示すユーザーを含む Azure Active Directory (Azure AD)...
- 質問268 Site1 という名前の Microsoft SharePoint Online サイトを含む ...
- 質問269 ネットワークには、Azure AD Connect を使用して contoso.com と...
- 質問270 SSPR の計画された変更を実装します。 User3 が SSPR を使用しよ...
- 質問271 You have a Microsoft 365 tenant. You need to identify users ...
- 質問272 You need to configure the assignment of Azure AD licenses to...
- 質問273 Sub1 という名前の Azure サブスクリプションがあります。 Micro...
- 質問274 次の表に示すユーザーを含む Azure Active Directory (Azure AD)...
- 質問275 次の表に示すグループを含む Azure AD テナントがあります。 (Ex...
- 質問276 ネットワークには、Azure AD Connect を使用して contoso.com と...
- 質問277 ホットスポットに関する質問 Group1 と Group2 という 2 つのグ...
- 質問278 次のグループを含む Azure Active Directory (Azure AD) テナン...
- 質問279 次の図に示すように、ユーザー管理者ロールの Azure AD Privileg...
- 質問280 ユーザー ID が侵害される可能性に関する技術要件を満たす必要が...
- 質問281 storage1 という名前のストレージ アカウントと WebApp1 という...
- 質問282 Litware ユーザーへの Azure AD ライセンスの割り当てを構成する...
- 質問283 Microsoft 365 E5 サブスクリプションをお持ちです。 ユーザー ...
- 質問284 Microsoft 365 E5 テナントがあります。 App1 という名前のクラ...
- 質問285 新しい Azure AD テナントを展開する予定です。 テナントに対し...
- 質問286 QUESTION NO: 73ネットワークには、Azure Active Directory (Azu...
- 質問287 You have a Microsoft 365 E5 subscription. You need to create...
- 質問288 注: この質問は、同じシナリオを提示する一連の質問の一部です。...
- 質問289 ユーザー ID が侵害される可能性に関する技術要件を満たす必要が...
- 質問290 Microsoft 365 テナントがあります。 ユーザーは、Microsoft 365...
- 質問291 ホットスポットに関する質問 Microsoft 365 E5 サブスクリプショ...
- 質問292 役割の割り当てを管理するために使用する役割を特定する必要があ
- 質問293 会社には Microsoft 365 テナントがあります。 すべてのユーザー...
- 質問294 Azure Active Directory Premium Plan 2 ライセンスを持つ Azure...
- 質問295 Microsoft 365 E5 サブスクリプションがあり、そこには User1 と...
- 質問296 Azure AD テナントがあります。 App1 という名前の新しいエンタ...
- 質問297 Microsoft 365 テナントがあります。 Azure Active Directory (A...
- 質問298 Microsoft 365 テナントがあります。 すべてのユーザーは携帯電...
- 質問299 Microsoft 365 E5 サブスクリプションがあり、そこには User1、U...
- 質問300 Microsoft 365 テナントがあります。 条件付きアクセス ポリシー...
- 質問301 次のグループを含む Azure Active Directory (Azure AD) テナン...
- 質問302 You have an Azure Active Directory (Azure AD) tenant that co...
- 質問303 パッケージ1に計画されている変更を実施する必要があります。ア
- 質問304 ネットワークには、Microsoft Entra Connect を使用して Microso...
- 質問305 You have an Azure AD tenant that contains the users shown in...
- 質問306 Microsoft 365 テナントがあります。 認証情報が漏洩したユーザ...
- 質問307 次の表に示すカスタム ロールを含む Azure サブスクリプションが...
- 質問308 次の表に示すリソースを含む Azure サブスクリプションがありま...
- 質問309 Microsoft 365 E5 テナントがあります。 App1 という名前のクラ...
- 質問310 Microsoft Office 365 Enterprise E3 ライセンスが割り当てられ...
- 質問311 ホットスポットに関する質問 RG1 と RG2 という 2 つのリソース ...
- 質問312 ホットスポットに関する質問 Microsoft 365 テナントと、adatum....
- 質問313 You have an Azure subscription that contains an Azure Automa...
- 質問314 デフォルトのアプリ登録設定を持つAzure Active Directory (Azur...
- 質問315 You have an Azure Active Directory (Azure AD) tenant that ha...
- 質問316 ネットワークには、contoso.com というオンプレミスの Active Di...
- 質問317 You have an Azure AD tenant that contains the users shown in...
- 質問318 次の表に示すユーザーを含む Azure AD テナントがあります。 (Ex...
- 質問319 次の表に示すリソースを含む Azure サブスクリプションがありま...
- 質問320 SSPR の計画された変更を実装します。 User3 が SSPR を使用しよ...
- 質問321 User1 というユーザーを含む Azure サブスクリプションがありま...
- 質問322 Litware ユーザーへの Azure AD ライセンスの割り当てを構成する...
- 質問323 次の表に示すオブジェクトを含む Azure Active Directory (Azure...
- 質問324 次の表に示すユーザーを含む Azure Active Directory (Azure AD)...
- 質問325 User1 という名前のユーザーと、次の表に示すグループを含む Azu...
- 質問326 Identity Governance を使用してアプリケーションアクセスの割り...
- 質問327 5,000人のユーザーがいるMicrosoft 365テナントがあります。その...
- 質問328 会社には contoso.com という名前の Azure Active Directory (Az...
- 質問329 会社には Microsoft 365 テナントがあります。 すべてのユーザー...
- 質問330 Microsoft 365 E5 サブスクリプションをお持ちです。 Microsoft ...
- 質問331 You need to configure app registration in Azure AD to meet t...
- 質問332 次の表に示すユーザーを含む Azure AD テナントがあります。 (Ex...
- 質問333 Azure Active Directory (Azure AD) テナントに、User1、User2、...
- 質問334 contoso.com という Microsoft Entra テナントがあり、このテナ...
- 質問335 注: この質問は、同じシナリオを提示する一連の質問の一部です。...
- 質問336 Microsoft 365 E5 テナントがあります。 App1 という名前のクラ...
- 質問337 You need to configure the detection of multi staged attacks ...
- 質問338 ユーザー ID が侵害される可能性に関する技術要件を満たす必要が...
- 質問339 ユーザー ID が侵害される可能性に関する技術要件を満たす必要が...
- 質問340 オンプレミス ネットワークには、Active Directory ドメイン サ...
- 質問341 You have an Azure Active Directory (Azure AD) tenant that sy...
- 質問342 Microsoft 365 E5 サブスクリプションがあり、そこには User1、U...
- 質問343 Sub1 という名前の Azure サブスクリプションがあり、そこには R...
- 質問344 ホットスポットに関する質問 ネットワークには、contoso.com と...
- 質問345 RG1というリソースグループと、User1、User2、User3、User4とい...
- 質問346 オンプレミスネットワークには、Azure AD Connect を使用して Az...
- 質問347 次の表に示すリソースを含む Azure サブスクリプションがありま...
- 質問348 ケーススタディ 1 - Contoso 社 概要 Contoso 社は、モントリオ...
- 質問349 Group1 の図に示すように、Group1 という名前のグループを含む M...
