- ホーム
- Microsoft
- PL-300J - Microsoft Power BI Data Analyst (PL-300日本語版)
- Microsoft.PL-300J.v2025-08-16.q203
- 質問108
有効的なPL-300J問題集はJPNTest.com提供され、PL-300J試験に合格することに役に立ちます!JPNTest.comは今最新PL-300J試験問題集を提供します。JPNTest.com PL-300J試験問題集はもう更新されました。ここでPL-300J問題集のテストエンジンを手に入れます。
PL-300J問題集最新版のアクセス
「452問、30% ディスカウント、特別な割引コード:JPNshiken」
営業マネージャーのレポート要件を満たす視覚化を作成する必要があります。
視覚化をどのように作成すればよいですか? 回答するには、回答領域で適切なオプションを選択してください。
注意: 正しい選択ごとに 1 ポイントが付与されます。

視覚化をどのように作成すればよいですか? 回答するには、回答領域で適切なオプションを選択してください。
注意: 正しい選択ごとに 1 ポイントが付与されます。
正解:
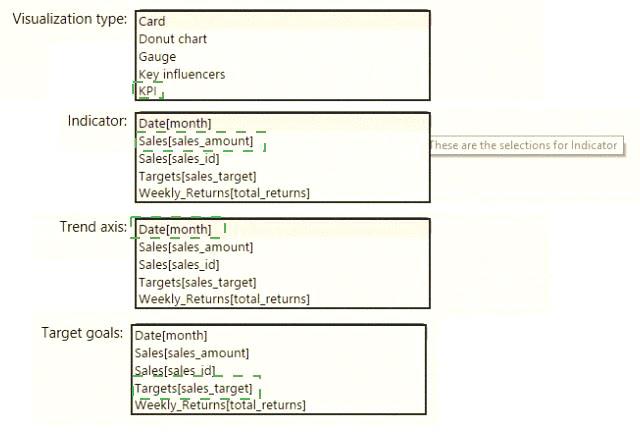
Explanation:
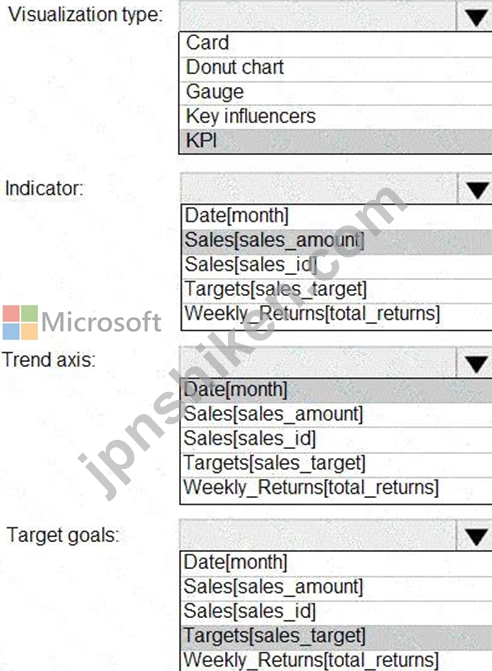
Scenario: The sales managers require a visual to analyze sales performance versus sales targets.
Box 1: KPI
A Key Performance Indicator (KPI) is a visual cue that communicates the amount of progress made toward a measurable goal.
Box 2: Sales[sales_amount]
Box 3: Date[month]
Time > FiscalMonth. This value will represent the trend.
Box 4: Targets[sales_target]
Reference:
https://docs.microsoft.com/en-us/power-bi/visuals/power-bi-visualization-kpi

- 質問一覧「203問」
- 質問1 注: この質問は、同じシナリオを提示する一連の質問の一部です。...
- 質問2 注: この問題は、同じシナリオを提示する一連の問題の一部です。...
- 質問3 Sales、Customer、Date、Productという名前の4つのテーブルを含...
- 質問4 Purer 81 Desktop を Cassandra データベースに接続しようとしま...
- 質問5 Power BI を使用して、次の要件を満たす四半期利益レポートを作...
- 質問6 Model! という名前の Power Bl セマンティック モデルがあり、Sa...
- 質問7 次の表に示すセマンティック モデルをホストする Fabric テナン...
- 質問8 Sales、Product、Date という名前の 3 つのテーブルを含む Micro...
- 質問9 遅延注文の割合を返すメジャーを作成する必要があります。 DAX ...
- 質問10 次の表に示すように、アクセシビリティのために Power BI レポー...
- 質問11 Microsoft ExcelスプレッドシートからデータをインポートするPow...
- 質問12 50 個の JSON ファイルを含むフォルダーがあります。 ファイルの...
- 質問13 Power Query Editorを使用して、次のステップを作成します。 = T...
- 質問14 Power BI レポートがあります。レポートにはインタラクションの...
- 質問15 次の図に示すように、「Carriers」というテーブルからの情報を表...
- 質問16 過去6年間のデータを視覚化して比較するための折れ線グラフを作
- 質問17 売上データを含むRPT1というPower B1レポートを作成します。デー...
- 質問18 次の表に示す CSV ファイルがあります。 (Exhibit) ファイル内の...
- 質問19 カスタマーサービスという名前のワークスペースにレポートを公開
- 質問20 次の図に示すようなチャートを作成する予定です。 (Exhibit) 表...
- 質問21 展示に示されている折れ線グラフができました。([展示] タブをク...
- 質問22 Power BI を使用して財務レポートを作成しています。 「Date」と...
- 質問23 展示に示されている Power Bl モデルを作成する予定です。([展示...
- 質問24 データセットを含むPowerBlワークスペースがあります。レポート...
- 質問25 「Sales」という名前の単一のレポートを含む Power BI ワークス...
- 質問26 ユーザーの苦情を含むCSVファイルがあります。このファイルには...
- 質問27 次の表に示すデータ ソースを含む Power Bl セマンティック モデ...
- 質問28 次のテーブルを含む Power Bl セマンティック モデルがあります...
- 質問29 注:この質問は、同じシナリオを提示する一連の質問の一部です。
- 質問30 次の図に示すテーブル ビジュアルを含む Power B1 レポートがあ...
- 質問31 Power Query エディターには、ProductCategory、ProductSubCateg...
- 質問32 データソースにインデックスキーを追加し、大文字と小文字を正規
- 質問33 次の Employees という名前のテーブルを含む Power B1 セマンテ...
- 質問34 RLS のデータ モデルにリレーションシップを作成する必要があり...
- 質問35 注:この質問は、同じシナリオを提示する一連の質問の一部です。
- 質問36 次の図に示すダッシュボードがあります。 (Exhibit) 次の図のよ...
- 質問37 ワークスペースにメンバーを追加する機能をユーザーに提供する必
- 質問38 学校の出席状況を分析するためのPower BIデータセットを作成する...
- 質問39 Power BIレポートを作成する必要があります。レポートの最初のペ...
- 質問40 Power Query エディターを使用してデータをプロファイリングして...
- 質問41 注:この質問は、同じシナリオを提示する一連の質問の一部です。
- 質問42 テーブルを含むPower B1セマンティックモデルがあります 次の要...
- 質問43 貸借対照表データを日付テーブルに関連付けるには、貸借対照表デ
- 質問44 Power B1セマンティックモデルには、Dim LocationとFact Deliver...
- 質問45 100を超える公開されたデータセットがあります。 データセットの...
- 質問46 ユーザーの苦情を含む CSV ファイルがあります。このファイルに...
- 質問47 Store というテーブルを含む Power BI モデルを作成しています。...
- 質問48 次の表に示すテーブルを含む Microsoft Power BI データ モデル...
- 質問49 Power B1 Desktop を使用して、File1 という Microsoft Excel フ...
- 質問50 App1という名前のPowerBIアプリがあります。App1ワークスペース...
- 質問51 Power BI セマンティック モデルには、Table1 というテーブルが...
- 質問52 列を含むソースがあります。その列には大文字と小文字が区別され
- 質問53 部門内の従業員数を時間の経過とともに示す折れ線グラフがありま
- 質問54 Power BI Desktop には、テーブルを含むデータセットがあります...
- 質問55 1 ページを含む Power BI レポートがあります。このページには、...
- 質問56 セマンティック モデルを作成する必要があります。 セマンティッ...
- 質問57 Power Bl Desktop を使用して、Azure DevOps の Analytics から...
- 質問58 列を含むデータソースがあります。列には大文字と小文字が区別さ
- 質問59 Power B1セマンティックモデルには、「Sales」と「Forecast」と...
- 質問60 売上テーブルには、過去 5 年間から今日までの日別の売上記録が...
- 質問61 次の図に示すビジュアルを含むレポート ページがあります。 (Exh...
- 質問62 次の図に示すデータセットがあります。 (Exhibit) ビジュアルに...
- 質問63 ionには、「Temperature Readings」というテーブルを含むPower B...
- 質問64 CityData と Sales という 2 つのテーブルを持つ Microsoft Powe...
- 質問65 Power BIデータモデルに「Employees」というテーブルが含まれて...
- 質問66 パフォーマンス アナライザーの結果は次の図のようになります。 ...
- 質問67 PowerBiレポートがあります。レポートには、日付ごとに総売上高...
- 質問68 注: この質問は、同じシナリオを提示する一連の質問の一部です。...
- 質問69 Microsoft Power Bl Desktop で PBiX ファイルを開こうとすると...
- 質問70 次の図に示すように、「Transactions」という名前のクエリを表示...
- 質問71 Power Bi ダッシュボードがダッシュボード展示に表示されていま...
- 質問72 会社の人事部門のレポートのコレクションがあります。 HR部門の...
- 質問73 バスケット分析を実行するために、Microsoft Power BI インポー...
- 質問74 PowerBIサービスにRetailAnalysisという名前のアプリワークスペ...
- 質問75 納期遵守レポートを作成する必要があります。レポートには、遅延
- 質問76 ユーザーが適切な粒度レベルでのみ予測を表示できるように、デー
- 質問77 次の図に示す Power BI データ モデルがあります。 (Exhibit)...
- 質問78 損益データセットが作成されたら、ビジネスユニットアナリストが
- 質問79 「Sales」というテーブルを含むPower BIモデルがあります。Sales...
- 質問80 Power BI で、会社の北西部地域の販売地域に関する売上レポート...
- 質問81 既存のレポートを使用して、携帯電話の縦向きモードで頻繁に表示
- 質問82 次の「Location」という名前のテーブルがあります。 (Exhibit) G...
- 質問83 Power B1 セマンティック モデルがあります。 前年比(YOY)の収...
- 質問84 レポートを作成して、営業チームがその業績と売上の推進要因を理
- 質問85 営業部門のレポート要件を満たすために何を作成する必要がありま
- 質問86 販売データを含む Model1 という名前のセマンティック モデルが...
- 質問87 次の 3 つの列を含むテーブルがあります。 * 市 * 総売上高 * 職...
- 質問88 注:この質問は、同じシナリオを提示する一連の質問の一部です。
- 質問89 データレイクからCSVファイルをインポートする「Customer」とい...
- 質問90 月次取引抽出のフォルダーがあります。 トランザクション データ...
- 質問91 Microsoft Teams で完全にホストされているプロジェクト管理アプ...
- 質問92 冷蔵庫からストリーミングされる IoT 温度データを表示する Powe...
- 質問93 Microsoft Excel ブックには、Sheet1 と Sheet2 という 2 つのシ...
- 質問94 ReportA という名前の Power B1 レポートがあります。 ユーザー...
- 質問95 注:この質問は、同じシナリオを提示する一連の質問の一部です。
- 質問96 「Products」と「Categories」という名前の 2 つの CSV ファイル...
- 質問97 オンプレミスのデータ ゲートウェイがあります。 インポート ス...
- 質問98 「レポート」という名前の Power BI レポートと「ダッシュボード...
- 質問99 次の表に示すように、Country という名前の列を含む DiMCountrie...
- 質問100 注: この問題は、同じシナリオを提示する一連の問題の一部です。...
- 質問101 Power B1 レポートに、Page1、Page2、Page3 という 3 つのページ...
- 質問102 会社の人事部門向けのレポートのコレクションがあります。 過去
- 質問103 ビジネス ユニット、部門、製品カテゴリのデータを一貫して定義
- 質問104 多くの複雑なDAX式を含むデータモデルがあります。式には、RELAT...
- 質問105 次の列を含む「Pens」という名前のデータセットがあります。 * ...
- 質問106 製造プロセスの品質を監視するPowerBIダッシュボードがあります...
- 質問107 次の図に示すビジュアルを含む Power Bl レポートがあります。 (...
- 質問108 営業マネージャーのレポート要件を満たす視覚化を作成する必要が
- 質問109 Power BI でデータ モデルを作成します。 レポート開発者とユー...
- 質問110 100 を超える列を返す API があります。以下は列名のサンプルで...
- 質問111 Power Query エディターを使用してデータを活用します。 column1...
- 質問112 セマンティック モデルを powerbi.com に公開します。 以下の各...
- 質問113 注:この質問は、同じシナリオを提示する一連の質問の一部です。
- 質問114 注:この質問は、同じシナリオを提示する一連の質問の一部です。
- 質問115 ビジネス インテリジェンス (Bl) 開発者が、オンプレミスの Micr...
- 質問116 Power BI セマンティック モデルがあります。 セマンティック モ...
- 質問117 Power BI Desktop を使用して、「Customer」と「Contacts」とい...
- 質問118 3ページを含むレポートがあります。ページの1つには、KPIの視覚...
- 質問119 Power BIを使用して、「顧客詳細」ワークシートと「注文」テーブ...
- 質問120 Power Query エディターを使用して、Query 1 と Query2 という名...
- 質問121 Power B1レポートがあります。このレポートには、複数の地域の売...
- 質問122 Salesというテーブルを含むセマンティックモデルがあります。こ...
- 質問123 Model1 という名前の Power BI セマンティック モデルがあり、こ...
- 質問124 Power Bl レポートに含める必要がある年間売上データを受け取り...
- 質問125 注:この質問は、同じシナリオを提示する一連の質問の一部です。
- 質問126 Total Sales という名前のメジャーを含む Power Bl レポートがあ...
- 質問127 Azure SQL データベースには次の 3 つのバージョンがあります。 ...
- 質問128 Power BI Desktop でレポートを作成しています。 coll という名...
- 質問129 次の図に示すようなデータ系統があります。 (Exhibit) ドロップ...
- 質問130 注:この質問は、同じシナリオを提示する一連の質問の一部です。
- 質問131 あまり使用されず、1 時間ごとに更新されるセマンティック モー...
- 質問132 販売データを Power BI モデルにインポートする「All Sales」と...
- 質問133 Power Bi モデルとレポートを作成しています。 データ モードに ...
- 質問134 次の図に示す権限を持つデータセットがあります。 ドロップダウ
- 質問135 トップ顧客レポートを作成する必要があります。 どのようなタイ
- 質問136 Power Bl サービスを使用してダッシュボードを作成しています。 ...
- 質問137 レポートをサポートするために必要な Power BI データセットの最...
- 質問138 複数のダッシュボードがあります。 ユーザーがpowerbi.comから利...
- 質問139 Microsoft Power BI レポートがあります。PBIX ファイルのサイズ...
- 質問140 powerbi.comでホストされているPowerBlレポートがあり、部門マネ...
- 質問141 erp1 という名前の Azure SQL データベースのデータを使用する P...
- 質問142 選択した四半期の 10 個の製品カテゴリにわたる利益を比較するビ...
- 質問143 貸借対照表レポートの期末残高を取得するには、どの DAX 式を使...
- 質問144 四半期ごとの販売実績データを含む Power B1 データセットがあり...
- 質問145 Power B1を使用して顧客向けの売上請求書を作成する予定です。ソ...
- 質問146 商品リストと収益結果の関係性を構築する必要があります。ソリュ
- 質問147 会社の営業部門向けに、Microsoft Excel からデータをインポート...
- 質問148 Power Query エディターで 10,000 行を生成するクエリを確認して...
- 質問149 1,500行のデータを含む見込み顧客リストがあります a。リストに...
- 質問150 トランザクションという名前のテーブルから消費者の購入パターン
- 質問151 列を含むソースがあります。その列には大文字と小文字が区別され
- 質問152 ファイル サーバーに Microsoft Excel ファイルがあります。 Pow...
- 質問153 次の図に示すように、powerbi.com を開きます。 (Exhibit) ドロ...
- 質問154 次のデータを含む Power BI モデルがあります。 (Exhibit) Date ...
- 質問155 データソースにインデックスキーを追加し、大文字と小文字を正規
- 質問156 Power B1 ワークスペースでホストされている Finance という名前...
- 質問157 Note: This question is part of a series of questions that pr...
- 質問158 遅延注文の割合を返すメジャーを作成する必要があります。 DAX ...
- 質問159 Power BI で財務レポートを準備しています。 次の図に示すように...
- 質問160 レポートの要件を満たすデータモデルを設計する必要があります。
- 質問161 データセットを作成する必要があります。どのデータセットモード
- 質問162 次の図に示すフィールドを含む Power B1 レポートがあります。 (...
- 質問163 Note: This question is part of a series of questions that pr...
- 質問164 (Exhibit) ParentEmployeeID列に示されているように、各従業員に...
- 質問165 Power Bl には、共有データセットに基づく report1 という名前の...
- 質問166 注: この質問は、同じシナリオを示す一連の質問の一部です。この...
- 質問167 注:この質問は、同じシナリオを提示する一連の質問の一部です。
- 質問168 カードの視覚化を含むレポートがあります。 設計の労力を最小限
- 質問169 Azure SQL データベース データ ソースから日付テーブルと売上テ...
- 質問170 同じテーブルと列を含む 2 つの Azure SQL データベースがありま...
- 質問171 データセットのサイズを最小限に抑える必要があります。ソリュー
- 質問172 Power B1セマンティックモデルには、Query 1、Query 2、Query 3...
- 質問173 次の図に示すように、UnitslnStock という名前の列があります。 ...
- 質問174 次の図に示すテーブルを含む Power Bl データセットを作成します...
- 質問175 Population と Date という 2 つのテーブルを含む Power Bl モデ...
- 質問176 次のテーブルを含む Power B1 セマンティック モデルがあります...
- 質問177 次の表に示すデータを含む Microsoft Excel スプレッドシートが...
- 質問178 マネージャーは 1 つの国のみを代表できます。 次の要件を満たす...
- 質問179 Power BI Desktop を Cassandra データベースに接続しようとしま...
- 質問180 大きなデータセットをPowerQueryEditorにインポートします。 列...
- 質問181 Orders、Date、Cityという名前の3つのテーブルを含むMicrosoftPo...
- 質問182 展示で表示されるビジュアルがあります。([展示] タブをクリック...
- 質問183 4ページを含むレポートがあります。各ページには、同じ4つのフィ...
- 質問184 注:この質問は、同じシナリオを提示する一連の質問の一部です。
- 質問185 注:この質問は、同じシナリオを提示する一連の質問の一部です。
- 質問186 Power Query エディターを使用して、Country という名前の列を含...
- 質問187 注: この問題は、同じシナリオを提示する一連の問題の一部です。...
- 質問188 「Phone」という列を含むテーブルがあります。以下は「Phone」列...
- 質問189 AzureSQLデータベースから複数のテーブルをインポートするPBiXフ...
- 質問190 既存の環境データに関する懸念に対処するにはどうすればよいでし
- 質問191 Power Query エディターで Power Bl Desktop 10 プロファイル デ...
- 質問192 インポートストレージモードで実行されるModel1というPower B1セ...
- 質問193 注:この質問は、同じシナリオを提示する一連の質問の一部です。
- 質問194 時間通りの配送レポートを作成する必要があります。 レポートに
- 質問195 複数のビジュアルを含むPower BIレポートを作成しています。スク...
- 質問196 2 つのテーブルを含む Microsoft Excel ブックがあります。 Powe...
- 質問197 営業マネージャーのレポート要件を満たす視覚化を作成する必要が
- 質問198 次の表に示す Azure SQL データベースがあります。 (Exhibit) 次...
- 質問199 Rビジュアルを使用して、500,000人の顧客のマップを作成します。...
- 質問200 Power BI レポートにページが含まれています。このページには、...
- 質問201 Azure SQL データベースをデータソースとして使用する「Report!...
- 質問202 使用頻度が低く、1 時間ごとに更新されるデータセットがあります...
- 質問203 次のテーブルを含む Power BI モデルがあります。 * 製品 (製品I...
