- ホーム
- Microsoft
- PL-300J - Microsoft Power BI Data Analyst (PL-300日本語版)
- Microsoft.PL-300J.v2024-12-23.q160
- 質問142
有効的なPL-300J問題集はJPNTest.com提供され、PL-300J試験に合格することに役に立ちます!JPNTest.comは今最新PL-300J試験問題集を提供します。JPNTest.com PL-300J試験問題集はもう更新されました。ここでPL-300J問題集のテストエンジンを手に入れます。
PL-300J問題集最新版のアクセス
「452問、30% ディスカウント、特別な割引コード:JPNshiken」
次の列を含む Pens という名前のデータセットがあります。
アイテム
単価
注文数量
単価と注文数量の関係を示す視覚化を作成する必要があります。ソリューションでは、単価と注文数量が類似した注文を強調表示する必要があります。
どのタイプのビジュアライゼーションとどの機能を使用する必要がありますか? 回答するには、回答領域で適切なオプションを選択してください。
注: 正しく選択するたびに 1 ポイントの価値があります。

アイテム
単価
注文数量
単価と注文数量の関係を示す視覚化を作成する必要があります。ソリューションでは、単価と注文数量が類似した注文を強調表示する必要があります。
どのタイプのビジュアライゼーションとどの機能を使用する必要がありますか? 回答するには、回答領域で適切なオプションを選択してください。
注: 正しく選択するたびに 1 ポイントの価値があります。
正解:
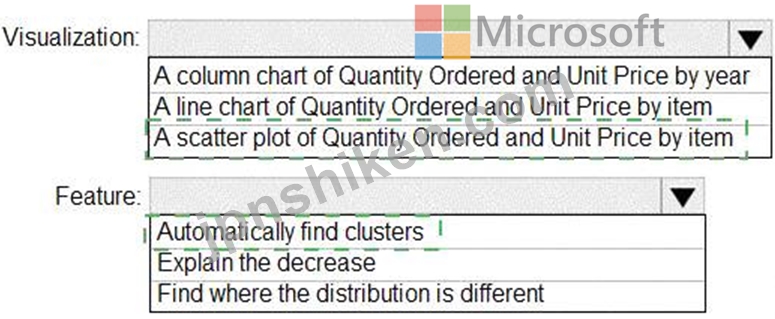
Explanation:
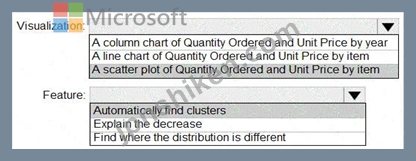
Box 1: A scatter plot...
A scatter chart always has two value axes to show: one set of numerical data along a horizontal axis and another set of numerical values along a vertical axis. The chart displays points at the intersection of an x and y numerical value, combining these values into single data points. Power BI may distribute these data points evenly or unevenly across the horizontal axis. It depends on the data the chart represents.
Box 2: Automatically find clusters
Scatter charts are a great choice to show patterns in large sets of data, for example by showing linear or non- linear trends, clusters, and outliers.
Reference:
https://docs.microsoft.com/en-us/power-bi/visuals/power-bi-visualization-scatter

- 質問一覧「160問」
- 質問1 PowerBlレポートがあります 1000万行を含むDalaiという名前のテ...
- 質問2 Products と Sales という名前の 2 つのテーブルを含む Power B1...
- 質問3 次の図に示すテーブル ビジュアルを含む Power B1 レポートがあ...
- 質問4 Power BI Desktop には、テーブルを含むデータセットがあります...
- 質問5 100 万行を超える大規模なデータセットがあります。テーブルには...
- 質問6 Power BI Desktop で、3 つのページを含むレポートを作成してい...
- 質問7 データセットをpowerbi.comに公開します。 次の各ステートメント...
- 質問8 PowerBIレポートをMicrosoftSharePointOnlineページに埋め込みま...
- 質問9 ダッシュボード展示に Power Bi ダッシュボードが表示されていま...
- 質問10 売上高による製品カテゴリのランキングを示すビジュアルを作成し
- 質問11 アンケート結果を含む Excel1 という名前の Microsoft Exert ス...
- 質問12 RLSのデータセットに関係を作成する必要があります。 あなたは何...
- 質問13 次の図に示すように、インジケーターを使用して範囲外の値を表示
- 質問14 Power B1 を使用して顧客向けの売上請求書を作成する予定です。...
- 質問15 RLSのデータセットに関係を作成する必要があります。 あなたは何...
- 質問16 ビジネスインテリジェンス(Bl)開発者は、DirectQueryを使用し...
- 質問17 あなたの会社には 10 州に従業員がいます。 同社は最近、各州を...
- 質問18 学校の出席状況を分析するために Power Bl データセットを作成す...
- 質問19 What is the minimum number of Power BI datasets needed to su...
- 質問20 Power BI Desktop でレポートを作成しています。モデルには次の...
- 質問21 注: この質問は、同じシナリオを提示する一連の質問の一部です。...
- 質問22 Opportunity という名前のテーブルを含む Power Bl セマンティッ...
- 質問23 次のデータを含む Power Bl モデルがあります。 (Exhibit) Date ...
- 質問24 次の図に示すようなデータ系統があります。 (Exhibit) ドロップ...
- 質問25 2 つのテーブルを含む Microsoft Excel ブックがあります。 Powe...
- 質問26 レポート要件に基づいて月を表示するには、計算列を作成する必要
- 質問27 Power BI Desktop にレポートがあります。 展示に示されているよ...
- 質問28 4つの販売地域があります。各地域には複数のセールスマネージャ
- 質問29 Power Query エディターを使用してデータをプロファイリングして...
- 質問30 PowerQueryEditorでクエリを開きます。 各列の空の値のパーセン...
- 質問31 PowerBIテナントがあります。 財務データセットを使用し、PDFフ...
- 質問32 Azure SQL データベース データ ソースから日付テーブルと売上テ...
- 質問33 Power BI を使用して財務レポートを作成しています。 「Date」と...
- 質問34 PowerBIサービスにRetailAnalysisという名前のアプリワークスペ...
- 質問35 次の図に示すように、powerbi.com を開きます。 (Exhibit) ドロ...
- 質問36 ユーザーがQ&Aを使用して自然言語の質問を行えるように、Micros...
- 質問37 注: この質問は、同じシナリオを提示する一連の質問の一部です。...
- 質問38 注:この質問は、同じシナリオを提示する一連の質問の一部です。
- 質問39 Note: This question is part of a series of questions that pr...
- 質問40 Sales テーブルには、過去 5 年間から今日の日付までの日別の売...
- 質問41 元のダッシュボードの展示に示されているように、単一のレポート
- 質問42 Employees という名前のテーブルを含む Power BI データ モデル...
- 質問43 貸借対照表データを日付テーブルに関連付けることができるように
- 質問44 注: この質問は、同じシナリオを示す一連の質問の一部です。この...
- 質問45 マネージャーは 1 つの国のみを代表できます。 次の要件を満たす...
- 質問46 売上データと約1,000行を含むテーブルがあります。 テーブル内の...
- 質問47 注:この質問は、同じシナリオを提示する一連の質問の一部です。
- 質問48 示す: (Exhibit) 要件を満たすレポートを作成する必要がありま...
- 質問49 Sales、Customer、Date、Productという名前の4つのテーブルを含...
- 質問50 Power Query エディターを使用してデータをプロファイリングして...
- 質問51 ユーザーの苦情を含む CSV ファイルがあります。このファイルに...
- 質問52 注:この質問は、同じシナリオを提示する一連の質問の一部です。
- 質問53 次のデータを含む Power BI モデルがあります。 (Exhibit) Date ...
- 質問54 次の表に示すデータを含む Microsoft Excel スプレッドシートが...
- 質問55 Power BI Desktop でレポートを作成しています。 coll という名...
- 質問56 Page1、Page2、およびPage3という名前の3つのページを含むPowerB...
- 質問57 複数のダッシュボードがあります。 ユーザーがpowerbi.comから利...
- 質問58 テーブル ビジュアルを含む Power Bl レポートがあります。ビジ...
- 質問59 注:この質問は、同じシナリオを提示する一連の質問の一部です。
- 質問60 Microsoft Power Bl レポートに含める必要がある収益データを受...
- 質問61 Power BI を使用して、次の要件を満たす四半期利益レポートを作...
- 質問62 MicrosoftPowerBlレポートがあります。PBIXファイルのサイズは55...
- 質問63 注:この質問は、同じシナリオを提示する一連の質問の一部です。
- 質問64 PowerBiDesktopを使用してPowerBlレポートを作成しています。 ト...
- 質問65 複数のドキュメントライブラリを含むMicrosoftSharePointOnline...
- 質問66 Revenue という名前のメジャーを含むテーブル ビジュアルを含む ...
- 質問67 次の表に示すテーブルを含むデータベースから、顧客のトランザク
- 質問68 Microsoft PowerBlServiceを使用してダッシュボードを作成します...
- 質問69 Power BI Desktop を使用して、Microsoft Excel データ ソースを...
- 質問70 注:この質問は、同じシナリオを提示する一連の質問の一部です。
- 質問71 4ページを含むレポートがあります。各ページには、同じ4つのフィ...
- 質問72 ionには、TemperatureReadingsという名前のテーブルを含むPowerB...
- 質問73 1,500行のデータを含む見込み顧客リストがあります a。リストに...
- 質問74 次の表に示すテーブルを含む販売システムがあります。 (Exhibit)...
- 質問75 カードの視覚化を含むレポートがあります。 設計の労力を最小限
- 質問76 倉庫出荷部門の通知要件を満たすソリューションを作成する必要が
- 質問77 Power BIReportServer用に最適化されたPowerBIDesktopを使用して...
- 質問78 Sheet1 と Sheet2 という名前の 2 つのシートを含む Microsoft E...
- 質問79 主要な影響要因のビジュアルを使用して、注文で販売されるアイテ
- 質問80 Power Query エディターを使用して、次の図に示されているデータ...
- 質問81 行レベルのセキュリティ(RLS)を使用するPowerBlレポートがあり...
- 質問82 次の図に示すように、Power Bl レポートで折れ線グラフを作成し...
- 質問83 CityDataとSalesという名前の2つのテーブルを持つMicrosoftPower...
- 質問84 注:この質問は、同じシナリオを提示する一連の質問の一部です。
- 質問85 次の表に示す CSV ファイルがあります。 ファイル内のデータをプ...
- 質問86 Power Query エディターを使用してデータを活用します。 column1...
- 質問87 BI データセットと接続されたレポートがあります。 データセット...
- 質問88 MicrosoftPowerBIレポートがあります。PBIXファイルのサイズは55...
- 質問89 注: この質問は、同じシナリオを提示する一連の質問の一部です。...
- 質問90 次の図に示すように、UnitslnStockという列があります。 (Exhibi...
- 質問91 Phone という名前の列を含むテーブルがあります。以下は、[電話]...
- 質問92 EmailAddressという名前のフィールドを含むCustomerという名前の...
- 質問93 共有データセットに基づくreport1という名前のレポートがPowerBl...
- 質問94 MicrosoftPowerBlダッシュボードがあります。 ダッシュボードの...
- 質問95 いくつかのレポートを含むPowerBlワークスペースがあります。 レ...
- 質問96 Power BL レポートを作成しています。 ユーザーはモバイル デバ...
- 質問97 複数の地域の昨年の売上データを表示するレポートを作成する予定
- 質問98 データ モデル内のテーブルから未使用の列を削除します。これに
- 質問99 製品の売上を常に分析する Power BI データ モデルがあります。...
- 質問100 What should you do to address the existing environment data ...
- 質問101 Salesという名前の単一ページのレポートを含むPowerBlワークスペ...
- 質問102 次の表に示す Azure SQL データベースがあります。 (Exhibit) 次...
- 質問103 注:この質問は、同じシナリオを提示する一連の質問の一部です。
- 質問104 営業部門のユーザーのアクセスを構成する必要があります。ソリュ
- 質問105 棒グラフと縦棒グラフを含むレポートがあります。棒グラフは、顧
- 質問106 5 つのブックマークを含む Power Bi レポートがあります。 ユー...
- 質問107 次の表に示すテーブルからデータを使用する分析レポートを作成し
- 質問108 レポート要件を満たすようにデータが更新されていることを確認す
- 質問109 倉庫在庫データに関するレポートを作成します a.このデータセ
- 質問110 次の図に示すテーブルを含む Power Bl レポートがあります。 (Ex...
- 質問111 四半期ごとの販売実績データを含む Power B1 データセットがあり...
- 質問112 データセットを含むPowerBlワークスペースがあります。レポート...
- 質問113 販売トランザクションを含む Azure SQL データベースがあります...
- 質問114 次の分析をサポートするOrdersという名前のPowerBlレポートがあ...
- 質問115 売上高による製品カテゴリーのランキングを示すビジュアルを作成
- 質問116 Orders、Date、Cityという名前の3つのテーブルを含むMicrosoftPo...
- 質問117 You have a CSV file that contains user complaints. The file ...
- 質問118 エグゼクティブのビジュアルに必要な関係を作成する必要がありま
- 質問119 複数のレポートで使用される Power Bl テーマを作成する必要があ...
- 質問120 Microsoft Power Bl レポートがあります。PBIX ファイルのサイズ...
- 質問121 Sales という名前の単一のレポートを含む Power BI ワークスペー...
- 質問122 Total Sales という名前のメジャーを含む Power Bl レポートがあ...
- 質問123 You have the Power BI data model shown in the following exhi...
- 質問124 セマンティック モデルを powerbi.com に公開します。 次の各ス...
- 質問125 Microsoft Power Bl ダッシュボードがあります。ダッシュボード...
- 質問126 Rビジュアルを使用して、500,000人の顧客のマップを作成します。...
- 質問127 会社の人事部門のレポートのコレクションがあります。 HR部門の...
- 質問128 Microsoft Power Bl を使用して、SalesDetail というテーブルの...
- 質問129 Power Query エディターからクエリを実行しようとすると、次のエ...
- 質問130 AzureBlobストレージ内の数十のフラットファイルから供給される...
- 質問131 注:この質問は、同じシナリオを提示する一連の質問の一部です。
- 質問132 ReportA という名前の Power B1 レポートがあります。 ユーザー...
- 質問133 4 ページを含む Power BI レポートがあります。 すべてのページ...
- 質問134 次の図に示すフィールドを含む Power B1 レポートがあります。 (...
- 質問135 列を含むソースがあります。列には大文字と小文字が区別される日
- 質問136 Power Bl Desktop を使用して、Azure DevOps の Analytics から...
- 質問137 次の図に示すようにビジュアルを作成する必要があります。 (Exhi...
- 質問138 Power BI レポートを作成する必要があります。レポートの最初の...
- 質問139 Storeという名前のテーブルを含むPowerBIモデルを作成しています...
- 質問140 Power Bi Desktop を使用して Azure SQL データベースに接続して...
- 質問141 次の図に示すビジュアルを含むレポート ページがあります。 (Exh...
- 質問142 次の列を含む Pens という名前のデータセットがあります。 アイ...
- 質問143 遅延注文の割合を返すメジャーを作成する必要があります。 DAX式...
- 質問144 MicrosoftPowerBIデータセットをpowerbi.comに公開します。デー...
- 質問145 会社の北西地域の販売地域の販売レポートをPowerBlで作成してい...
- 質問146 Power Query Editorを使用して、次のステップを作成します。 = T...
- 質問147 次の表に示すように、アクセシビリティのために Power BI レポー...
- 質問148 バスケット分析を実行するために、Microsoft Power Bl インポー...
- 質問149 注:この質問は、同じシナリオを提示する一連の質問の一部です。
- 質問150 Power Bi Desktop を使用して、Power Bl データ モデルと空白の...
- 質問151 PowerBiモデルとレポートを作成しています。 Product Productと...
- 質問152 Power Query エディターを使用してデータをプロファイリングして...
- 質問153 サプライヤー品質ダッシュボードを含む Power Bl ワークスペース...
- 質問154 100を超える公開されたデータセットがあります。 データセットの...
- 質問155 列を含むソースがあります。列には大文字と小文字が区別される日
- 質問156 50 個の JSON ファイルを含むフォルダーがあります。 ファイルの...
- 質問157 Power BIモデルを管理するには、Salesとproductという名前のテー...
- 質問158 注:この質問は、同じシナリオを提示する一連の質問の一部です。
- 質問159 AzureSQLデータベースから複数のテーブルをインポートするPBiXフ...
- 質問160 列を含むソースがあります。列には大文字と小文字が区別される日
