- ホーム
- Microsoft
- MB-230J - Microsoft Dynamics 365 Customer Service Functional Consultant (MB-230日本語版)
- Microsoft.MB-230J.v2024-08-05.q129
- 質問117
有効的なMB-230J問題集はJPNTest.com提供され、MB-230J試験に合格することに役に立ちます!JPNTest.comは今最新MB-230J試験問題集を提供します。JPNTest.com MB-230J試験問題集はもう更新されました。ここでMB-230J問題集のテストエンジンを手に入れます。
MB-230J問題集最新版のアクセス
「330問、30% ディスカウント、特別な割引コード:JPNshiken」
次の要件を満たすために、どのツールを作成して構成する必要があるかを選択する必要があります。
どのツールを構成する必要がありますか? 答えるには、適切なツールを正しい要件にドラッグします。各ツールは、1 回以上使用することも、まったく使用しないこともできます。ペイン間の分割バーをドラッグするか、コンテンツを表示するためにスクロールする必要がある場合があります。
注: それぞれの正しい選択は 1 ポイントの価値があります。

どのツールを構成する必要がありますか? 答えるには、適切なツールを正しい要件にドラッグします。各ツールは、1 回以上使用することも、まったく使用しないこともできます。ペイン間の分割バーをドラッグするか、コンテンツを表示するためにスクロールする必要がある場合があります。
注: それぞれの正しい選択は 1 ポイントの価値があります。
正解:
Explanation:
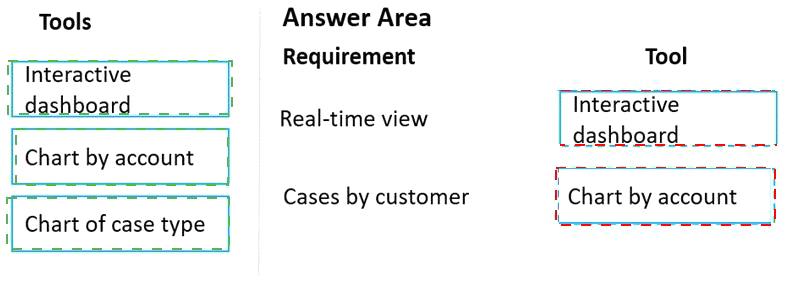
Box 1: Interactive dashboard
Support representatives must have a real-time view of cases assigned to them, including the status of each case.
What is an interactive dashboard?
An interactive dashboard is a data visualization tool that allows business teams to track, analyze, and display metrics of various sorts. Dashboards feature charts, tables, maps, and other visualizations to help viewers understand the story the data tells.
Box 2: Chart by account
Support representatives must be able to see a graphic view of cases by customer that are assigned to them.

- 質問一覧「129問」
- 質問1 コール センターの顧客サービス用オムニチャネルを実装していま
- 質問2 あなたは Dynamics 365 for Customer Service 管理者です。全文...
- 質問3 顧客が許可されている数を超えてケースを開くことができないよう
- 質問4 顧客のクレームに対する回答を検索する必要があります。 どのタ
- 質問5 Dynamics 365 for Customer Service を実装しています。 さまざ...
- 質問6 顧客は Dynamics 365 for Customer Service を使用しています。 ...
- 質問7 あなたは会社のオムニチャネル管理者です。同社はチャットチャネ
- 質問8 会社は Dynamics 365 Customer Service を使用しています。 エー...
- 質問9 あなたは Dynamics 365 for Customer Service 管理者です。 権限...
- 質問10 Dynamics 365 Customer Service でエージェント スクリプトを作...
- 質問11 注: この質問は、同じシナリオを示す一連の質問の一部です。この...
- 質問12 ケースが正しく処理されるようにする必要があります。 あなたは
- 質問13 ある企業が Dynamics 365 Customer Service Insights を評価して...
- 質問14 会社は、チャット ウィジェットでカスタム コンテキスト変数を有...
- 質問15 注:この質問は、同じシナリオを提示する一連の質問の一部です。
- 質問16 過去1か月以内にケースをオープンした顧客に調査を送信します。 ...
- 質問17 注: この質問は、同じシナリオを提示する一連の質問の一部です。...
- 質問18 会社は Dynamics 365 for Customer Service を実装しています。 ...
- 質問19 注:この質問は、同じシナリオを提示する一連の質問の一部です。
- 質問20 顧客は、現在の暦年で 3 つのケースが進行中で、2 つのケースが...
- 質問21 注: この質問は、同じシナリオを提示する一連の質問の一部です。...
- 質問22 病気の予定に適切なリソースをスケジュールできるようにする必要
- 質問23 Dynamics 365 Customer Service Insights を実装しています。 製...
- 質問24 自転車の販売とサービスを行っている会社です。同社は Dynamics ...
- 質問25 顧客サービス用のオムニチャネルを設定しています。 次のタスク
- 質問26 クライアントは、ケース解決プロセスの実装を計画しています。
- 質問27 Dynamics 365 for Customer Service を使用しています。 ケース...
- 質問28 注記; この質問は、同じシナリオを提示する一連の質問の一部です...
- 質問29 企業は Dynamics 365 Customer Voice を実装しています。会社は...
- 質問30 ある会社は、顧客サービスにオムニチャネルを使用しています。
- 質問31 あなたは会社のオムニチャネルのスーパーバイザーです。Power BI...
- 質問32 カスタマーサービス担当者は、サービスレベル契約(SLA)を手動...
- 質問33 あなたの会社は Dynamics 365 Customer Service を使用していま...
- 質問34 あなたは Dynamics 365 for Customer Service 管理者です。組織...
- 質問35 パラメータごとに機能を選択する必要があります。 各パラメータ
- 質問36 Dynamics 365 for Customer Serviceで単一のビジネスプロセスフ...
- 質問37 注: この質問は、同じシナリオを提示する一連の質問の一部です。...
- 質問38 会社は Dynamics 365 Customer Voice を使用しています。 会社は...
- 質問39 あなたは Dynamics 365 for Customer Service のシステム管理者...
- 質問40 ケース担当者のワークスペース要件を満たすようにシステムを構成
- 質問41 あなたは、権限が制限された Dynamics 365 Customer Service Hub...
- 質問42 あなたは Dynamics 365 for Customer Service 管理者です。あな...
- 質問43 Dynamics 365 for Customer Service環境を管理します。 顧客の資...
- 質問44 あなたは Dynamics 365 Customer Service のシステム管理者です...
- 質問45 ある会社は、Dynamics 365 Customer Service のオムニチャネルを...
- 質問46 会社は Dynamics 365 Customer Service を実装しています。 修理...
- 質問47 企業は Dynamics 365 Customer Service を使用しています。 スケ...
- 質問48 ある会社が Dynamics 365 Customer Service ワークスペースを実...
- 質問49 Dynamics 365 for Customer Service の実装をカスタマイズしてい...
- 質問50 資格テンプレートを作成する必要があります。システム設定で、サ
- 質問51 エージェント用の新しいエージェント スクリプトを作成する必要
- 質問52 Dynamics 365 Customer Service の機能を使用する外部向けポータ...
- 質問53 あなたは Dynamics 365 for Customer Service 管理者です。 あな...
- 質問54 あなたは、Dynamics 365 Customer Service を使用する会社のエー...
- 質問55 顧客にはカスタマー サービス環境があります。 顧客はサービスの...
- 質問56 お客様の声(VoC)の調査を作成しています。 受信者が調査の登録...
- 質問57 あなたは Dynamics 365 管理者です。 さまざまなシナリオで作成...
- 質問58 企業は Dynamics 365 Customer Service を使用しています。 ヘル...
- 質問59 会社の顧客サービス用オムニチャネルを実装しています。 同社は
- 質問60 企業は Dynamics 365 Customer Service を使用しています。 エー...
- 質問61 顧客サービス用オムニチャネルのチャネルを設定しています。 Wha...
- 質問62 コール センターの顧客サービス用オムニチャネルを実装していま
- 質問63 顧客サービスの実装のためにオムニチャネルをカスタマイズしてい
- 質問64 3 日間と 7 日間の時間枠を満たすようにシステムを構成する必要...
- 質問65 次のグラフとビューを表示する個人用ダッシュボードを構築する必
- 質問66 Dynamics 365 Customer Service 組織は、ルーティング ルールを...
- 質問67 Dynamics 365 Customer Service 環境を管理します。同社は毎日何...
- 質問68 Dynamics 365 for Customer Service を管理します。 休日のリス...
- 質問69 顧客サービス スーパーバイザーのボットに、最低限必要なセキュ
- 質問70 あなたはカスタマー サービス スケジュール管理者です。 顧客に...
- 質問71 コール センターの顧客サービス用オムニチャネルの実装をカスタ
- 質問72 あなたはヘルプ デスクの Dynamics 365 管理者です。CaseB を Ca...
- 質問73 あなたは会社のオムニチャネルのスーパーバイザーです。 この会
- 質問74 コンタクト センターのスーパーバイザーには、チャネル別の運用
- 質問75 あなたは Dynamics 365 for Customer Service 管理者です。 あな...
- 質問76 企業はカスタマーサービスを利用しています。 同社は、オムニチ
- 質問77 クレジット カード会社は Dynamics 365 Customer Service を使用...
- 質問78 あなたは Dynamics 365 for Customer Service 管理者です。 強化...
- 質問79 会社は Dynamics 365 for Customer Service を使用しています。 ...
- 質問80 技術者が活用できるソリューションを実装する必要があります。
- 質問81 最小特権の原則を使用して、Dynamics 365 Connected Customer Se...
- 質問82 会社は Dynamics 365 Customer Service を展開します。同社は製...
- 質問83 ナレッジ ベースを使用する場合は、適切なアクションを選択する
- 質問84 会社がDynamics 365 for Customer Serviceを使用しています。キ...
- 質問85 Dynamics 365 for Customer Service インスタンスを構成していま...
- 質問86 Microsoft Dynamics 365 Customer Service Hub でインタラクティ...
- 質問87 注: この質問は、同じシナリオを提示する一連の質問の一部です。...
- 質問88 顧客は、サードパーティ アプリケーションからのデータを Custom...
- 質問89 一般的な顧客からの問い合わせを処理する仮想エージェントを作成
- 質問90 Power Virtual Agents チャットボットからのトレンド結果を表示...
- 質問91 分析機能をセットアップする必要があります。 あなたは何をする
- 質問92 ある会社は、顧客サービスにオムニチャネルを使用しています。管
- 質問93 コール センターの顧客サービス用オムニチャネルでキューを構成
- 質問94 クレームに関する回答を保存するようにシステムを構成する必要が
- 質問95 会社は Dynamics 365 Customer Service を使用しています。 ユー...
- 質問96 正しい設定を構成する必要があります。 どの設定を構成する必要
- 質問97 スケジュール タブにアクセスできるユーザーと、使用するテーブ
- 質問98 セットアップごとにどの設定を構成する必要があるかを選択する必
- 質問99 世界 101 の国/地域で事業を展開する企業は、Dynamics 365 Custo...
- 質問100 顧客サービスの実装のためにオムニチャネルをカスタマイズしてい
- 質問101 あなたは、インバウンド コール センターのオムニチャネル スー...
- 質問102 あなたは、ユーザーが電話または電子メールを使用してケースを送
- 質問103 ある会社ではカスタマー サービスを導入しており、次のことを実
- 質問104 ある企業ではカスタマー サービスを導入しています。 同社は顧客...
- 質問105 Dynamics 365 Customer Service を構成しています。 子ケースは...
- 質問106 会社の管理者は、顧客サービス用に Dynamics 365 オムニチャネル...
- 質問107 サービス マネージャーは、エージェント キューで多数のケースを...
- 質問108 電話ベースのケースのキューを構成する必要があります。 この目
- 質問109 あなたは Dynamics 365 システム管理者です。 カスタマー サービ...
- 質問110 サービス レベル アグリーメントを実装する必要があります。 ど...
- 質問111 企業は Dynamics 365 Customer Service を使用しています。製造...
- 質問112 顧客のデフォルトの資格を設定します。 デフォルトのエンタイト
- 質問113 Dynamics 365 for Customer Serviceを使用しています。 顧客の資...
- 質問114 あなたはワクチンを販売する製薬会社で働いています。 ワクチン
- 質問115 契約の資格を構成する必要があります。 何を使うべきですか?回
- 質問116 あなたは Dynamics 365 システム管理者です。 カスタマー サービ...
- 質問117 次の要件を満たすために、どのツールを作成して構成する必要があ
- 質問118 顧客サービス実装用のオムニチャネルをカスタマイズしています。
- 質問119 あなたはDynamics 365 for Customer Service管理者です。 資格を...
- 質問120 注: この質問は、同じシナリオを提示する一連の質問の一部です。...
- 質問121 要件をサポートするには、オブジェクトを作成して構成する必要が
- 質問122 注: この質問は、同じシナリオを示す一連の質問の一部です。この...
- 質問123 ある企業は Dynamics 365 Customer Service と Microsoft Teams ...
- 質問124 ある企業は、LOT デバイスで Dynamics 365 Customer Service を...
- 質問125 Dynamics 365 Customer Service を使用しています。 会社との署...
- 質問126 顧客には顧客サービス環境があります。顧客はサービス スケジュ
- 質問127 ケースの確認ステップを追加する必要があります。 何を編集する
- 質問128 あなたは Dynamics 365 Customer Service システム管理者です。 ...
- 質問129 会社は Dynamics 365 Customer Service を使用しています。会社...
