Explanation
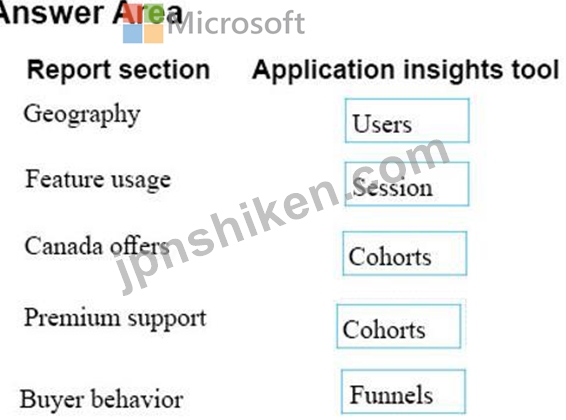
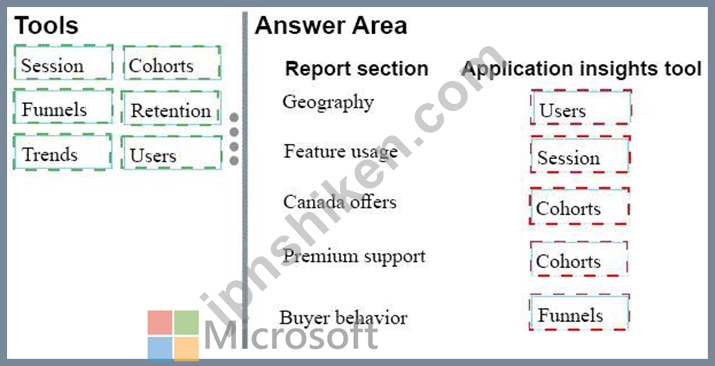
Box 1 Geography: Users
"the Country or Region from which users access the application"
The Users panel allows you to understand important details about your users in a variety of ways. You can use
this panel to understand such information as where your users are connecting from, details of their client, and
what areas of your application they're accessing.
Box 2: Feature usage: Session
" how often and for how long users browse the catalog"
The Sessions panel is similar to the Users panel. Where Users helps you understand details about the users
accessing your application, Sessions helps you understand how those users used your application.
Box 3 Canada Offers: Cohorts
" how many Canadian customers visited the offers page"
A Cohort is a set of users grouped on similar characteristics. You can use cohorts to filter data in other panels
allowing you to analyze particular groups of users. For example, you might want to analyze only users who
completed a purchase, or users from Canada.
Box 4 Premium support: Cohorts
"how much time Premium customers spend on the support page"
A Cohort is a set of users grouped on similar characteristics. You can use cohorts to filter data in other panels
allowing you to analyze particular groups of users. For example, you might want to analyze only users who
completed a purchase, or users from Canada.
Box 5: Buyer behavior: Funnels
"the percentage of users that added items to a shopping cart and completed purchases"
Funnels focus on what you want users to do. A funnel represents a set of steps in your application and the
percentage of users who move between steps. For example, you could create a funnel that measures the
percentage of users who connect to your application who search product. You can then see the percentage of
users who add that product to a shopping cart, and then the percentage of those who complete a purchase.