- ホーム
- Tableau
- TDS-C01-JPN - Tableau Desktop Specialist (TDS-C01日本語版)
- Tableau.TDS-C01-JPN.v2024-08-13.q151
- 質問53
有効的なTDS-C01-JPN問題集はJPNTest.com提供され、TDS-C01-JPN試験に合格することに役に立ちます!JPNTest.comは今最新TDS-C01-JPN試験問題集を提供します。JPNTest.com TDS-C01-JPN試験問題集はもう更新されました。ここでTDS-C01-JPN問題集のテストエンジンを手に入れます。
TDS-C01-JPN問題集最新版のアクセス
「318問、30% ディスカウント、特別な割引コード:JPNshiken」
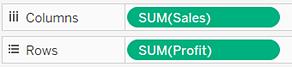
散布図を作成するには、少なくともいくつのメジャーが必要ですか?
正解:A
We can use scatter plots to visualize relationships between numerical variables!
In Tableau, you create a scatter plot by placing at least one measure on the Columns shelf and at least one measure on the Rows shelf (Total 2 minimum). If these shelves contain both dimensions and measures, Tableau places the measures as the innermost fields, which means that measures are always to the right of any dimensions that you have also placed on these shelves. The word "innermost" in this case refers to the table structure.
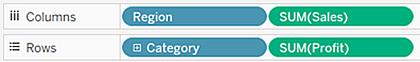
A scatter plot can use several mark types. By default, Tableau uses the shape mark type. Depending on your data, you might want to use another mark type, such as a circle or a square. For more information, see Change the Type of Mark in the View.
To create a scatter plot, follow the steps below:
In Tableau, you create a scatter plot by placing at least one measure on the Columns shelf and at least one measure on the Rows shelf (Total 2 minimum). If these shelves contain both dimensions and measures, Tableau places the measures as the innermost fields, which means that measures are always to the right of any dimensions that you have also placed on these shelves. The word "innermost" in this case refers to the table structure.
A scatter plot can use several mark types. By default, Tableau uses the shape mark type. Depending on your data, you might want to use another mark type, such as a circle or a square. For more information, see Change the Type of Mark in the View.
To create a scatter plot, follow the steps below:

- 質問一覧「151問」
- 質問1 ツリー マップでは、サイズは ________________ の最大の長方形...
- 質問2 箱ひげ図の箱は何を表していますか?
- 質問3 [マーク] カードのドロップダウン メニューを [自動] に設定する...
- 質問4 大まかに言えば、Tableau Desktop でデータセットをインポートし...
- 質問5 Tableau でメジャーの既定の集計を変更するにはどうすればよいで...
- 質問6 正誤問題: シートをストーリー内で直接使用することはできません...
- 質問7 ワークブック全体のフォントを更新したいと考えています。 デフ
- 質問8 TODAY () に基づいて日付の範囲を選択するには、どのタイプの日...
- 質問9 [物理テーブル] オプションが選択されている場合、抽出を正確に...
- 質問10 正誤問題: 両方のテーブルのすべての行が INNER JOIN で返される...
- 1コメント質問11 ビューを Microsoft Word 文書に貼り付けることができる画像とし...
- 質問12 2 つのテーブル間の結合を構築するデータ セットがあります。デ...
- 質問13 境界線と背景色を使用するとダッシュボードの項目を視覚的に強調
- 質問14 ほとんどの閲覧者は、ページの _____________ からコンテンツを...
- 質問15 [形状] オプションはどの 2 つのビューで使用できますか? 2 つ選...
- 質問16 2 つのデータセットに対して結合ではなくリレーションシップを使...
- 質問17 Sales という名前の連続した数値メジャーがあります。 Sales メ...
- 質問18 バージョン 10.5 以降、新しい抽出を作成すると、.tde 形式では...
- 質問19 ビューにメジャーを追加したときの Tableau のデフォルトの動作...
- 質問20 次のシナリオのうち、抽出を使用するよりもライブ接続を使用する
- 質問21 [データ] ペインから階層を作成する 2 つの使用例は何ですか? 2 ...
- 質問22 データセットを使用して、地域別に分類された平均数量を示す棒グ
- 質問23 ユニオン内のフィールド名が一致しない場合は、次のようになりま
- 質問24 次のビューがあるとします。新しいメジャーを行シェルフと列シェ
- 質問25 サーバーに接続するときに、潜在的なデータ接続の完全なリストを
- 質問26 参照線の範囲を定義する有効なオプションは次のうちどれですか? ...
- 質問27 混乱を避けるために、二重軸グラフを作成した後に何をすべきです
- 質問28 [データ] ペインの次のアイコンは何に使用されていましたか? 拡...
- 質問29 Tableau でダッシュボードを使用する場合に有効なレイアウト コ...
- 質問30 Tableau で軸を太字に設定するにはどうすればよいですか?...
- 質問31 Tableau で 1 人あたりの GDP をどのように計算しますか?...
- 質問32 正誤問題: 物理テーブルは個別 (正規化) のままであり、データ ...
- 質問33 次の図に示すように、[データ] ペインのフィールドにマウスを移...
- 質問34 [データの表示] ウィンドウには、デフォルトで _______________ ...
- 質問35 次のうち、Tableau データ ソース (.tds) を使用する利点はどれ...
- 質問36 正誤問題: 複数のメジャーの軸を単一の軸にブレンドすることはで...
- 質問37 散布図の視覚化ができました。 視覚化を密度マップとして構成す
- 質問38 ツールヒントのテキストの太字オプションにアクセスする 3 つの...
- 質問39 次のうち、Tableau で利益率を計算する正しい方法はどれですか?...
- 質問40 アニメーションは Tableau で既定で有効になっていますか?...
- 質問41 既定の Tableau リポジトリの場所を変更するにはどうすればよい...
- 質問42 複数の種類の並べ替えを使用するビジュアライゼーションがありま
- 質問43 ヒストグラムの作成に使用できるのは次のうちどれですか?
- 質問44 パーセント差のクイック表計算を使用する場合、最初のデータ値は
- 質問45 次のうち、データをグループ化する有効な方法はどれですか?
- 質問46 問30の答え:スキップ CoffeeChain テーブルを使用して、Profit ...
- 質問47 青色に表示される 2 種類のフィールドはどれですか? 2 つ選択し...
- 質問48 Tableau で連続フィールドをどのように識別しますか?
- 質問49 2016 年の米国の平均住宅価格を示すフィールドは、次の可能性が...
- 質問50 メジャーを個別にすることは可能ですか?
- 質問51 ビジュアライゼーションでマーク ラベルを表示する有効な方法は
- 質問52 連続フィルターで使用できる 2 つのフィルター モードはどれです...
- 質問53 散布図を作成するには、少なくともいくつのメジャーが必要ですか
- 質問54 Tableau のストーリー ポイントとは何ですか?
- 質問55 データセットを使用して、LATAM のみを含むように市場でフィルタ...
- 質問56 合計ではなく平均を自動的に集計するようにメジャーを変更するプ
- 質問57 ユーザーのダッシュボードに追加できるインタラクティブな要素は
- 質問58 Tableau が自動的に階層を作成するのは、どの 2 種類のデータで...
- 質問59 次のうち、Tableau で使用できるタイプのクイック フィルターで...
- 質問60 積み上げ棒グラフを使用する説得力のある理由は次のうちどれです
- 質問61 SUM(売上)/SUM(利益)の式を持つ計算フィールドによって何が作成...
- 質問62 二重軸グラフは、____________ という 2 つのメジャーを比較する...
- 質問63 ビンを作成するオプションはどのタイプのフィールドで使用できま
- 質問64 ________________ は、ワークブックと、サポートするローカル フ...
- 質問65 次のうち、Tableau でツールヒントのコンテンツを斜体にする有効...
- 質問66 不連続な日付部分は次のうちどれですか?
- 質問67 ダッシュボードのデータに基づいてリンクをカスタマイズするには
- 質問68 正誤問題: LEFT JOIN は、左側のテーブルからすべての行を返し、...
- 質問69 ____________ および ____________ の値を含む次元は連続できま...
- 質問70 Tableau でビジュアライゼーション用に軸が作成されるのはいつで...
- 質問71 Tableau は ____________ ディメンションと ______________ メジ...
- 質問72 視覚化でヘッダーを作成するには何を使用すればよいですか?
- 質問73 関係は __________________ で表され、____________________ で...
- 質問74 このユース ケースでは、各地域の利益別下位 10 製品を示すセッ...
- 質問75 ______________ は、どこを見ても、データの詳細レベルを指しま...
- 質問76 地理データ テーブルを使用して、州ごとの売上を示すマップを作
- 質問77 最初にフィルターを適用してから、上位 N 個または下位 N 個の要...
- 質問78 結合について誤っているのは次のうちどれですか?
- 質問79 [出荷日] - [注文日] を計算すると、_______________ が返されま...
- 質問80 Tableau を CSV データ ソースに接続するには、どのタイプの接続...
- 質問81 (Exhibit)
- 質問82 時系列テーブルを使用して、品目番号 ID ごとの売上を表示するク...
- 質問83 連続フィールドを正確に説明する 3 つの記述はどれですか。3 つ...
- 質問84 Tableau では、青と緑の色は何を表していますか?
- 質問85 ビジュアル グループを作成するための 2 つの正しい方法は何です...
- 質問86 Tableau で __________________ を使用して、データをクリーンア...
- 質問87 次のオプションのうち、測定値を最もよく表しているのはどれです
- 質問88 時系列テーブルを使用して、品揃えごとに分類された売上の前年比
- 質問89 1 つのデータ ソース内の複数のテーブルに一度に接続するには、...
- 質問90 日付値の 2 つの例は何ですか? 2 つ選択してください。
- 質問91 どのような状況でワークブックを PDF ドキュメントとして保存す...
- 質問92 ブレンドを使用する場合、プライマリ データ ソースとセカンダリ...
- 質問93 次の計算のうち、簡単な表計算を必要としないのはどれですか?
- 質問94 新しいデータソースに接続すると、元のデータソースを参照してい
- 質問95 事務用品カテゴリで利益が最も少なかったサブカテゴリは?
- 質問96 ビュー内のすべてのマークを最も詳細な粒度レベルで表示したい場
- 質問97 次のうち、Tableau でデータ抽出を使用する利点はどれですか?...
- 質問98 基準線を追加できるのは次のうちどれですか?
- 質問99 表計算や計算フィールドを必要とせずに使用できる集計はどれです
- 質問100 次のようなビジュアライゼーションが得られます。 (Exhibit) イ...
- 質問101 一般的なベスト プラクティスとして、円グラフに効果的に表示で
- 質問102 正誤問題: テーブルを関連付ける場合、リレーションシップを定義...
- 質問103 Tableau Server の本番環境での使用に推奨される RAM の最小量は...
- 質問104 Tableau でビューのマークに色を追加するにはどうすればよいです...
- 質問105 時系列テーブルを使用して、年と四半期ごとに分類された各品揃え
- 質問106 抽出において、完全リフレッシュと増分リフレッシュの 3 つの違...
- 質問107 データセットのダウンロード元: https://drive.google.com/drive...
- 質問108 次の展示に示されている関係キャンバスが表示されます。 (Exhibi...
- 質問109 ダッシュボードを画像ファイルとして共有する 2 つの方法は何で...
- 質問110 CoffeeChain テーブルを使用して、2012 年の初めから 2013 年末...
- 質問111 デフォルトでは、ビューに配置されたメジャーは ______________ ...
- 質問112 ストーリーの 2 つの使用例は何ですか? 2 つ選択してください。...
- 質問113 正誤問題: トレンド ラインは、数値フィールドまたは日付フィー...
- 質問114 連続した日付値を [行] シェルフにドラッグした場合の 2 つの結...
- 質問115 棒グラフがあるとします。ビューでラベルでグループ化すると、次
- 質問116 相対日付フィルターの場合、デフォルトのアンカーは____________...
- 質問117 Tableau サポート ケースを開くことができる有効な方法は次のう...
- 質問118 降順で並べ替えられたバーが常に含まれるグラフの種類は次のうち
- 質問119 https://drive.google.com/file/d/12AYHfiPWkwBmvH0zbumOURgUX6A...
- 質問120 cwurData テーブルを使用して、国ごとの出版物の数を機関別に表...
- 質問121 ______________ を色にドラッグすると、アイテムごとに異なる色...
- 質問122 ディメンションを [列] シェルフにドラッグし、メジャーを [行] ...
- 質問123 データ ブレンディングは、従来の _________________ 結合をシミ...
- 質問124 次のグラフのうち、マーク カードの [サイズ] オプションが機能...
- 質問125 CoffeeChain テーブルを使用して、州ごとの総経費を示すクロス集...
- 質問126 ブレット グラフの場合、少なくとも ____________ メジャーが必...
- 質問127 _________________ は、シートごとにデータ ソースの構成方法を...
- 質問128 ビュー/ビジュアライゼーションの構築に使用されるデータをエク
- 質問129 データ ソースを適切にクリーンアップし、いくつかの計算フィー
- 質問130 大まかに言えば、ユーザーが Tableau に接続すると、データ セッ...
- 質問131 エイリアスを正確に説明しているのはどれですか?
- 質問132 二軸グラフを作成した後に行うべき最も重要なことは何ですか?
- 質問133 複数のビジュアライゼーションを含むダッシュボードを画像として
- 質問134 与えられたマップで、次のフィールドのうち、サイズ、形状、詳細
- 質問135 品目番号 ID 列で地理データと時系列テーブルを結合し、マップ上...
- 質問136 Tableau では最大 ______ テーブルを結合できます...
- 質問137 拡大画像 (Exhibit) Tableau では、このビュー全体を何と呼んで...
- 質問138 Sales という名前の連続数値メジャーがあります。 Sales メジャ...
- 質問139 ______________ には、ビジュアライゼーション、ビジュアライゼ...
- 質問140 [データ] ペインから階層を作成する 2 つの使用例は何ですか? 2 ...
- 質問141 次のうち、次元について正しいものはどれですか?
- 質問142 巨大なデータセットを扱っている場合、コンテキスト フィルター
- 質問143 時系列テーブルを使用して、品揃えごとに分類された売上の前年比
- 質問144 ______________ を静的ツールとして使用して、Tableau Desktop ...
- 質問145 複数のデバイス用のダッシュボードを作成する場合、[デバイス プ...
- 質問146 フィールドの背景が青色の場合、それは何を意味しますか?
- 質問147 基準線の範囲を変更する 3 つのオプションは何ですか? 3つ選んで...
- 質問148 データ ペインからディメンションに地理的役割を手動で割り当て
- 質問149 通常、Tableau の日付は ______________ として扱われます...
- 質問150 グループ化されたフィールドに関連付けられているアイコンは____...
- 質問151 Tableau でワークシートを画像としてエクスポートする場合、次の...
