- ホーム
- Microsoft
- SC-300J - Microsoft Identity and Access Administrator (SC-300日本語版)
- Microsoft.SC-300J.v2025-11-17.q140
- 質問19
有効的なSC-300J問題集はJPNTest.com提供され、SC-300J試験に合格することに役に立ちます!JPNTest.comは今最新SC-300J試験問題集を提供します。JPNTest.com SC-300J試験問題集はもう更新されました。ここでSC-300J問題集のテストエンジンを手に入れます。
SC-300J問題集最新版のアクセス
「385問、30% ディスカウント、特別な割引コード:JPNshiken」
Azure サブスクリプションをお持ちです。
Azure AD ログは Log Analytics ワークスペースに送信されます。
ログをクエリし、ユーザーごとのサインイン数をグラフで表示する必要があります。
クエリをどのように完了すればよいですか? 回答するには、回答領域で適切なオプションを選択してください。

Azure AD ログは Log Analytics ワークスペースに送信されます。
ログをクエリし、ユーザーごとのサインイン数をグラフで表示する必要があります。
クエリをどのように完了すればよいですか? 回答するには、回答領域で適切なオプションを選択してください。
正解:
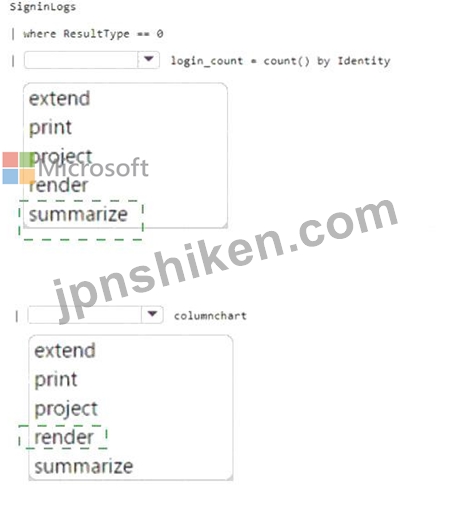
Explanation:
Box 1 =
SigninLogs
| where ResultType == 0
| summarize login_count = count() by identity
| render piechart
This query retrieves the sign-in logs, filters the successful sign-ins,summarizesthe count of sign-ins per user, and renders the result as a pie chart.
Box 2 = Render

- 質問一覧「140問」
- 質問1 ボストンオフィスから接続するユーザーに対して、MFA設定を構成...
- 質問2 次の表に示すキー コンテナーを含む Azure サブスクリプションが...
- 質問3 Microsoft 365 テナントがあります。 資格情報が漏洩したユーザ...
- 質問4 RG1 という名前のリソース グループを含む Azure サブスクリプシ...
- 質問5 Azure Active Directory (Azure AD) テナントに、User1、User2、...
- 質問6 次の表に示すカスタム ロールを含む Azure サブスクリプションが...
- 質問7 Microsoft Defender for Cloud Apps を使用する Microsoft 365 E...
- 質問8 User1 という名前のユーザーを含む Microsoft 365 サブスクリプ...
- 質問9 Sub1 という名前の Azure サブスクリプションがあります。 Micro...
- 質問10 Microsoft365テナントがあります。 Azure Active Directory(Azu...
- 質問11 注: この問題は、同じシナリオを提示する一連の問題の一部です。...
- 質問12 Contoso という Azure AD テナントがあり、Terms1 という利用規...
- 質問13 Azure AD テナントと App1 という名前の .NET Web アプリがあり...
- 質問14 Microsoft Entra テナントがあります。 特定の外部ドメインのユ...
- 質問15 fabrikam.comという名前のドメインを使用するMicrosoft365テナン...
- 質問16 最近のセキュリティ インシデントの問題を解決する必要がありま
- 質問17 ネットワークには、Azure Active Directory(Azure AD)テナント...
- 質問18 次のクラウド プラットフォームのアカウントがあります。 * アズ...
- 質問19 Azure サブスクリプションをお持ちです。 Azure AD ログは Log A...
- 質問20 ネットワークには、Microsoft Entraテナントと同期するオンプレ...
- 質問21 Azure Active Directory(Azure AD)テナントがあります。 リス...
- 質問22 conto.so.com という Azure Active Directory (Azure AD) テナン...
- 質問23 Microsoft 365 E5 サブスクリプションをお持ちです。 Review1 と...
- 質問24 Azure Monitor を使用して、Azure Active Directory (Azure AD) ...
- 質問25 contoso.onmicrosoft.com というドメイン名を使用する新しい Mic...
- 質問26 「Terms1」という名前の使用条件 (ToU) を含む Microsoft Entra ...
- 質問27 User1 という名前のユーザーと、次の表に示すグループを含む Azu...
- 質問28 タスク2 Salesforce アプリへのアクセス権を持つゲストユーザー...
- 質問29 Microsoft 36S サブスクリプションをご利用です。このサブスクリ...
- 質問30 会社には Microsoft 365 テナントがあります。 すべてのユーザー...
- 質問31 Microsoft 365 E5 サブスクリプションをお持ちです。 Microsoft ...
- 質問32 User1 というユーザーを含む Azure サブスクリプションがありま...
- 質問33 注: この質問は、同じシナリオを示す一連の質問の一部です。この...
- 質問34 タスク9 Sg-Operations グループのユーザーが My Apps ポータル...
- 質問35 Litware ユーザーへの Azure AD ライセンスの割り当てを構成する...
- 質問36 組織データへのアプリケーションアクセスに関して計画されている
- 質問37 Microsoft 365 E5 サブスクリプションをお持ちです。 Microsoft ...
- 質問38 Microsoft Enta ID P2 ライセンスを持つ Microsoft Entra テナン...
- 質問39 次の表に示す Azure Active Directory (Azure AD) ユーザーを作...
- 質問40 ユーザー ID が侵害される可能性に関する技術要件を満たす必要が...
- 質問41 多要素認証 (MFA) が適用され、セルフサービス パスワード リセ...
- 質問42 ネットワークには、Azure AD テナントと同期するオンプレミスの ...
- 質問43 タスク3 LinkedlnアプリケーションをSales and Marketingアクセ...
- 質問44 ユーザーが 70 歳以上のサインイン アラートをトリガーしたとき...
- 質問45 次の表に示すユーザーを含む Azure Active Directory (Azure AD)...
- 質問46 Groups1、Group2、Group3 という 3 つのグループと、次の表に示...
- 質問47 タスク10 Auditというグループを作成する必要があります。ソリュ...
- 質問48 contoso.comという名前のAzureActive Directory(Azure AD)テナ...
- 質問49 Microsoft 365 テナントがあります。 すべてのユーザーは、Micro...
- 質問50 次のオブジェクトを含むAzureActive Directory(Azure AD)テナ...
- 質問51 Azure AD テナントと、App1 という名前の Azure Web アプリがあ...
- 質問52 Sub1 ilia1 というAzureサブスクリプションがあり、そこには sto...
- 質問53 User1 という名前のユーザーを含む Microsoft Entra テナントが...
- 質問54 新しい Azure AD テナントをデプロイする予定です。 テナントに...
- 質問55 Microsoft365テナントがあります。 サインインアクティビティレ...
- 質問56 Microsoft Defender for Cloud Apps を使用する Microsoft 365 E...
- 質問57 次の表に示すリソースを含む Azure サブスクリプションがありま...
- 質問58 タスク8 Microsoft Entra ID への認証時に、すべてのユーザーが...
- 質問59 Microsoft Entra テナントがあります。 テナントのリスクの高い...
- 質問60 ゲストユーザーの招待に関する問題を解決する必要があります。Az...
- 質問61 次の表に示すユーザーを含むAzureActive Directory(Azure AD)...
- 質問62 次の表に示すユーザーを含む Azure AD テナントがあります。 (Ex...
- 質問63 Azure Monitor を使用して、Azure Active Directory (Azure AD) ...
- 質問64 litware.com に計画されている変更を適用する必要があります。何...
- 質問65 Azure Active Directory (Azure AD) テナントがあります。 次の...
- 質問66 注: この質問は、同じシナリオを示す一連の質問の一部です。この...
- 質問67 Microsoft Entra テナントがあります。 多数の新しいアプリがテ...
- 質問68 Windows Server を実行する Server! という名前のオンプレミス ...
- 質問69 Microsoft Entra Permissions Management を使用する Sub1 とい...
- 質問70 Microsoft 365 E5 サブスクリプションをお持ちです。 ユーザー ...
- 質問71 Microsoft 365 テナントをお持ちの場合 現在、基本認証を使用す...
- 質問72 注:この質問は、同じシナリオを提示する一連の質問の一部です。
- 質問73 注:この質問は、同じシナリオを提示する一連の質問の一部です。
- 質問74 役割の割り当てを管理するために使用する役割を特定する必要があ
- 質問75 User1 という名前のユーザーを含む Azure AD テナントがあります...
- 質問76 Microsoft 365 E5 サブスクリプションがあり、そこには User1 と...
- 質問77 次の仮想マシンが含まれる Azure サブスクリプションがあります...
- 質問78 Sub1 という Azure サブスクリプションがあり、そこには RG1 と ...
- 質問79 Microsoft Defender for Cloud Apps および Yammer を使用する M...
- 質問80 Microsoft 365 E5 テナントがあります。 App1 という名前のクラ...
- 質問81 Microsoft 36S テナントがあります。 高リスク国のリストを含む...
- 質問82 次の表に示すユーザーを含む Azure AD テナントがあります。 (Ex...
- 質問83 Azure Active Directory (Azure AD) テナントがあります。 テナ...
- 質問84 Microsoft 365 E5 サブスクリプションをお持ちです。 App1 とい...
- 質問85 注: この質問は、同じシナリオを示す一連の質問の一部です。この...
- 質問86 次の表に示すユーザーを含む Azure サブスクリプションがありま...
- 質問87 監視要件を満たすには、多段階攻撃の検出を構成する必要がありま
- 質問88 Azure ADテナントをお持ちの場合 ユーザーの同意設定を構成して...
- 質問89 A Datum から新規ユーザーにライセンスを割り当てる必要がありま...
- 質問90 技術要件を満たすために、ユーザー管理者ロールの設定を変更する
- 質問91 Microsoft365テナントがあります。 Azure Active Directory(Azu...
- 質問92 Microsoft 365 E5 サブスクリプションをご利用で、Microsoft Def...
- 質問93 Group1 と Group2 という 2 つのグループと、次の表に示すユーザ...
- 質問94 User1 という名前のユーザーと App1 という名前の登録済みアプリ...
- 質問95 Azure AD テナントがあります。 テンプレート ファイルをアップ...
- 質問96 Group1 の図に示すように、Group1 という名前のグループを含む M...
- 質問97 Microsoft 365 サブスクリプションをお持ちです。 ユーザーが企...
- 質問98 次の表に示すユーザーを含む Azure AD テナントがあります。 (Ex...
- 質問99 Automation1 という名前の Azure Automation アカウントと、Vaul...
- 質問100 注: この質問は、同じシナリオを示す一連の質問の一部です。この...
- 質問101 Microsoft 365 テナントがあります。 すべてのユーザーは携帯電...
- 質問102 Microsoft Entra ID P1 ライセンスを持つ Microsoft Entra テナ...
- 質問103 タスク6 Sg-Executiveのメンバーが会社のアプリにアクセスする前...
- 質問104 User1 という名前のユーザーを含む Azure AD テナントがあります...
- 質問105 注: この問題は、同じシナリオを提示する一連の問題の一部です。...
- 質問106 User1 という名前のユーザーと Vault1 という名前の Azure Key V...
- 質問107 Azure サブスクリプションをお持ちです。 エンタープライズ SaaS...
- 質問108 contoso.comという名前のAzureActive Directory(Azure AD)テナ...
- 質問109 Site1 という名前の Microsoft SharePoint Online サイトと、次...
- 質問110 Department1 という名前の管理単位を含む Azure Active Director...
- 質問111 Microsoft 365 E5 サブスクリプションがあります。 ユーザーは、...
- 質問112 あなたの会社には、次の表に示すユーザーを含む Azure AD テナン...
- 質問113 注:この質問は、同じシナリオを提示する一連の質問の一部です。
- 質問114 User1 という名前のユーザーが含まれる Sub1 という名前の Azure...
- 質問115 Microsoft 365 E5 サブスクリプションをお持ちです。 Gateway1 ...
- 質問116 次の表に示すリソースを含む contoso.com という名前の Azure AD...
- 質問117 Group3 というグループと Department1 という管理単位を含む Mic...
- 質問118 あなたの会社には、contoso.com という Azure Active Directory ...
- 質問119 Microsoft 365 サブスクリプションには、User1、User2、User3 と...
- 質問120 認証要件を満たすには、パスワード制限を実装する必要があります
- 質問121 管理要件を満たすには、LWGroup1 グループを作成する必要があり...
- 質問122 次の表に示すユーザーを含む Azure Ad テナントがあります。 (Ex...
- 質問123 ネットワークには、contoso.com というオンプレミスの Active Di...
- 質問124 Microsoft365テナントがあります。 すべてのユーザーは携帯電話...
- 質問125 会社には contoso.com という名前の Azure Active Directory (Az...
- 質問126 ネットワークには、Azure AD と同期し、次の表に示すユーザーを...
- 質問127 次の表に示すユーザーを含む Azure AD テナントがあります。 (Ex...
- 質問128 次の表に示すユーザーを含む Azure AD テナントがあります。 (Ex...
- 質問129 注: この問題は、同じシナリオを提示する一連の問題の一部です。...
- 質問130 Sub1 という名前の Azure サブスクリプションがあります。 Micro...
- 質問131 Sub1 という名前の Azure サブスクリプションがあり、そこには U...
- 質問132 Appl というオンプレミスアプリがあります。Microsoft Entra テ...
- 質問133 VM1 という名前の仮想マシンを含む Azure サブスクリプションが...
- 質問134 VM1 という名前の仮想マシンが含まれる Sub1 という名前の Azure...
- 質問135 ユーザー ID が侵害される可能性に関する技術要件を満たす必要が...
- 質問136 User1 という名前のユーザーを含む Azure Active Directory (Azu...
- 質問137 Azure Active Directory(Azure AD)テナントがあります。 次の...
- 質問138 Microsoft 365 サブスクリプションをお持ちです。 次の構成を持...
- 質問139 User1 というユーザーを含む Azure サブスクリプションがありま...
- 質問140 Microsoft Entra テナントにリンクされた Azure サブスクリプシ...
