- ホーム
- Microsoft
- PL-900J - Microsoft Power Platform Fundamentals (PL-900日本語版)
- Microsoft.PL-900J.v2024-12-20.q164
- 質問36
有効的なPL-900J問題集はJPNTest.com提供され、PL-900J試験に合格することに役に立ちます!JPNTest.comは今最新PL-900J試験問題集を提供します。JPNTest.com PL-900J試験問題集はもう更新されました。ここでPL-900J問題集のテストエンジンを手に入れます。
PL-900J問題集最新版のアクセス
「360問、30% ディスカウント、特別な割引コード:JPNshiken」
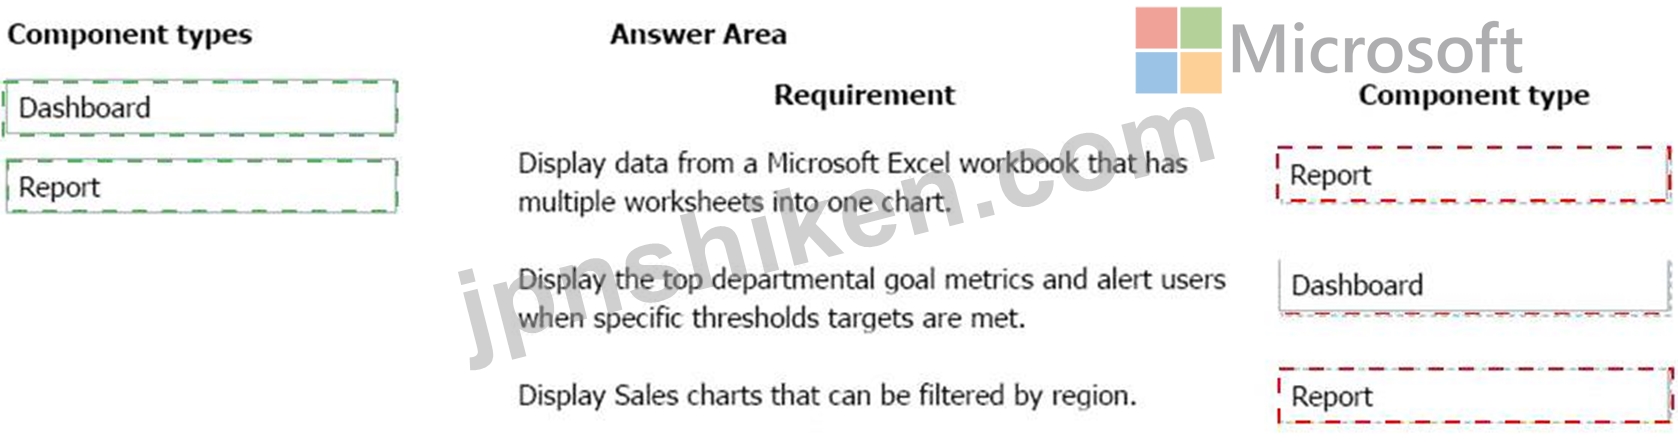
会社は、マネージャがチームに関する重要な情報を表示するために使用できる情報ポータルを作成することを計画しています。
会社が使用するPower BIコンポーネントのタイプを推奨する必要があります。
何を勧めますか?回答するには、適切なコンポーネントを正しい要件にドラッグします。各コンポーネントは、1回、複数回、またはまったく使用しない場合があります。ペイン間で分割バーをドラッグするか、コンテンツを表示するにはスクロールする必要がある場合があります。
注意。それぞれの正しい選択は1ポイントの価値があります。

会社が使用するPower BIコンポーネントのタイプを推奨する必要があります。
何を勧めますか?回答するには、適切なコンポーネントを正しい要件にドラッグします。各コンポーネントは、1回、複数回、またはまったく使用しない場合があります。ペイン間で分割バーをドラッグするか、コンテンツを表示するにはスクロールする必要がある場合があります。
注意。それぞれの正しい選択は1ポイントの価値があります。
正解:
Explanation:
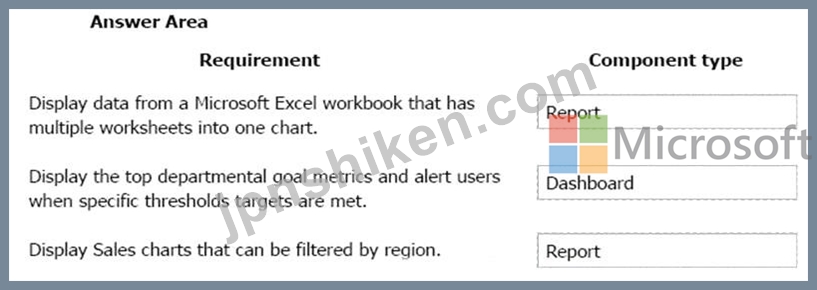
Box 1: Report
Reports are more detailed data displayed in many formats like chart, graphs list and in tabular, etc.
Box 2: Dashboard
Dashboards are a business key performance indicator view where it displays key values that can change business profits and can be glanced at one screen.
Box 3: Report
Power BI dashboards cannot slice and dice, but reports have many ways to filter and slice.
Note: Power BI dashboards are one placeholder to display the most important decision-making facts to run a business. But reports are more detailed data displayed in many formats like chart, graphs list and in tabular, etc. Reports are based on one dataset or one business unit data for example reports of a store belonging to California.
Reference:
https://www.educba.com/power-bi-dashboard-vs-report/

- 質問一覧「164問」
- 質問1 企業は、Power Automateを使用してビジネスプロセスを自動化して...
- 質問2 製造会社がAlBuilderを評価しています。 指定された要件に対応す...
- 質問3 手順:次の各ステートメントについて、ステートメントが真の場合
- 質問4 5 人のチームが、企業向けの Power Platform ソリューションを作...
- 質問5 企業は Microsoft 365、SharePoint Online、および Dynamics 365...
- 質問6 手順:次の各ステートメントについて、ステートメントが真の場合
- 質問7 ある企業は Microsoft Power Platform を使用して複数のデータ ...
- 質問8 モデル駆動型のPower Appsアプリを作成しています。あなたは、視...
- 質問9 PowerAutomate承認フローを作成しています。 手順:次の各ステー...
- 質問10 運送会社が Microsoft Power Platform のサービスと機能を評価し...
- 質問11 航空会社は、紛失した荷物デスクを管理するために Power Apps を...
- 質問12 データから生成機能を使用して、キャンバスアプリを作成します。
- 質問13 環境保護機関は、Microsoft Dataverse で標本と種という名前のテ...
- 質問14 A company is implementing Power Automate to streamline opera...
- 質問15 ある企業は Microsoft Power Platform を使用してソーシャル メ...
- 質問16 ユーザーがPower Appsで最初のキャンバスアプリを作成しています...
- 質問17 プロジェクトの締め切りが近づいています。プロジェクトマネージ
- 質問18 ある会社で近々セミナーが開催されます。招待状は既存の顧客ベー
- 質問19 テンプレートを使用してフローを作成します。追加のビジネスシナ
- 質問20 会社はMicrosoft365、Power Platform、およびDynamics365を使用...
- 質問21 会社はPowerAutomateを使用しています。 フローをトリガーできる...
- 質問22 あなたは会社に Power Apps を実装しています。 オンライン独自...
- 質問23 会社には、ほとんどの従業員が使用するPower Appsアプリがありま...
- 質問24 多数のPowerAutomateフローを作成しています。 フローのトリガー...
- 質問25 Power Automateを使用して、ユーザーがDynamics 365で販売機会を...
- 質問26 A company uses a model-driven app. You add several columns t...
- 質問27 ある企業は、Microsoft Power Apps と Microsoft Azure を使用し...
- 質問28 会社はDynamics365Salesを使用しています。商談が作成されるたび...
- 質問29 カスタムサイトマップを定義できるPowerAppsアプリを作成すると...
- 質問30 会社はMicrosoft Flowを使用しています。 作業指示書が作成され...
- 質問31 同僚が自動化されたクラウド フローを構築し、それをあなたと共
- 質問32 O:48 ドラッグアンドドロップ ある企業は、Microsoft Flow を使...
- 質問33 企業がPower Platformを評価しており、Power AppsとPower Automa...
- 質問34 あなたの会社は、ヘルプデスクシステムを作成し、Dynamics365カ...
- 質問35 Microsoft Flowを使用するのは初めてです。ユーザーの誕生日を抽...
- 質問36 会社は、マネージャがチームに関する重要な情報を表示するために
- 質問37 Microsoft Excel スプレッドシートをデータ ソースとして使用す...
- 質問38 Power Appポータルを作成します。 ユーザーがポータルにサインイ...
- 質問39 Power Blレポートで特定のしきい値を超える販売注文を表示する必...
- 質問40 次の各ステートメントについて、ステートメントがtrueの場合は[...
- 質問41 キャンバス アプリを作成しています。 アプリのフォーム ファク...
- 質問42 企業は、アンマネージド モデル駆動型アプリを作成します。 次の...
- 質問43 ある企業は Microsoft パワー プラットフォームを使用してサポー...
- 質問44 PowerAutomateフローを作成しています。 Microsoft Excel、Azure...
- 質問45 ある会社が、PowerPlatformアプリを外部サービスに接続して複雑...
- 質問46 あなたの会社は、休暇残高、オフィスの営業時間、旅費ポリシーの
- 質問47 モデル駆動型アプリを作成します。テーブル フォームに対してど
- 質問48 次の各ステートメントについて、ステートメントがtrueの場合は[...
- 質問49 あなたは、着信するセールス サポート コールを処理するためのセ...
- 質問50 会社はDynamics365サプライチェーン管理を使用しています。 特定...
- 質問51 会社は、会社の内部ネットワークにあるレガシーシステムからのデ
- 質問52 ある会社は、PowerPlatformテクノロジーを使用してソリューショ...
- 質問53 大手小売企業は、Power Apps、Microsoft Flow、およびCommon Dat...
- 質問54 定義を編集して変更を保存することにより、PowerAutomateフロー...
- 質問55 企業は、Power Pages で提供されるサイト デザイン テンプレート...
- 質問56 製造会社では、日中いつでも出荷品が毎日届きます。 郵便室の管
- 質問57 会社のPower Virtual Agentsチャットボットを作成しています。 ...
- 質問58 Power Blダッシュボードを作成します。 各オプションを要件に一...
- 質問59 ある会社は、Power Platformを使用して、特定のビジネス上の課題...
- 質問60 連絡先エンティティにビジネスルールを作成して、ユーザーが新し
- 質問61 Common Data Model(CDM)の主要コンポーネントとその機能につい...
- 質問62 ある会社は、PowerPlatform環境にPowerAppsを実装することを計画...
- 質問63 企業は、ビジネスプロセスの管理に役立つPowerAppsの実装を検討...
- 質問64 次の各ステートメントについて、ステートメントがtrueの場合は[...
- 質問65 Power Apps アプリを作成しています。視覚障害のある人でもアプ...
- 質問66 企業がCommon Data Service環境の作成を計画しています。 次の各...
- 質問67 モデル駆動型アプリを作成します。 アプリを共有する準備ができ
- 質問68 ある企業が、航空産業機器の現場検査とサービスを実施しています
- 質問69 会社がDynamics 365 Supply Chain Managementを使用しています。...
- 質問70 Power Virtual Agents を使用して、Power Apps ポータル用のチャ...
- 質問71 Microsoft 365とDynamics 365アプリを同じテナントに展開する利...
- 質問72 あなたは大手小売組織の営業マネージャーです。 古い販売時点管
- 質問73 会社は、Dynamics 365 Supply Chain managementとDynamics 365 S...
- 質問74 キャンバス アプリを作成しています。 アプリは、Microsoft OneD...
- 質問75 ある企業は、業界標準の独自データ ソースを使用する Power Plat...
- 質問76 ある企業は、営業チーム向けにモデル駆動型アプリを使用したいと
- 質問77 企業は、顧客情報を保存するために Microsoft Dataverse の新し...
- 質問78 ある会社がPower Platformアプリの実装を計画しています。同社は...
- 質問79 急速に成長している会社でサポートチームを管理します。 ログを
- 質問80 企業は、Common Data Serviceをデータストレージとして使用する...
- 質問81 ある企業は、モデル駆動型アプリを使用して顧客の食事の好みを記
- 質問82 教育機関: 次の各ステートメントについて、そのステートメントが...
- 質問83 あなたはカスタマーサービスマネージャーです。 お客様がケース
- 質問84 ある企業は現在、標準のアプリケーション ライフサイクル管理 (A...
- 質問85 会社は手動プロセスを使用して、カスタマーサポートへの電話のエ
- 質問86 会社がDynamics 365 Salesを使用しています。同社は、Sales Hub...
- 質問87 組織はPowerPlatformソリューションの作成を計画しており、Micro...
- 質問88 この質問では、BOLDテキストを評価して、それが正しいかどうかを...
- 質問89 企業は、Power BIを使用してビジネスシステムのデータを視覚化す...
- 質問90 会社は住宅用アパートを建設し、販売しています。同社はDynamics...
- 質問91 キャンバスアプリを作成しています。 アプリを設定する必要があ
- 質問92 あるホテルでは、清掃スタッフが部屋の清掃を終えるときに使用で
- 質問93 ある企業は、Power Automate を使用して、Twitter の投稿でその...
- 質問94 キャンバスアプリが最近更新されました。 この更新により、ユー
- 質問95 植物や園芸用品を販売する会社向けのモデル駆動型アプリを作成す
- 質問96 会社がPower Appsを使用しています。 会社の管理タスクを実行す...
- 質問97 Microsoft PowerPlatformとともにMicrosoftBusinessApplications...
- 質問98 会社がPower Appsポータルを構築しています。 会社の要件を満た...
- 質問99 Power BIのさまざまなソースからのデータを組み合わせるプロジェ...
- 質問100 ある企業は、Web サイトに Power Pages の使用を検討しています...
- 質問101 Power Automateを使用して、会社の製品について人々が何を言って...
- 質問102 ユーザー 1 は、会社用に複数の Power Bl ダッシュボードを作成...
- 質問103 ある企業は Microsoft Power Platform を導入しています。 営業...
- 質問104 会社は、よくある質問(FAQ)サイトを置き換えるチャットボット...
- 質問105 セールスアソシエイトが顧客のセールスリードを入力できるように
- 質問106 ある企業は、従業員が休暇を管理できるようにするキャンバス ア
- 質問107 ある企業は Power Platform ソリューションの導入を計画していま...
- 質問108 会社用の Copilot Studio コパイロットを作成しています。 以下...
- 質問109 ある会社は、サードパーティのクラウドベースのソリューションの
- 質問110 Power Bl ダッシュボードを作成する必要があります。 次の各文に...
- 質問111 あなたは大規模な小売組織の地区マネージャーです。Power BI を...
- 質問112 プロジェクトのタスクのリストを含むMicrosoft Excelブックがあ...
- 質問113 テスト環境で Power Automate クラウド フローを作成します。 フ...
- 質問114 カスタマー サービス マネージャーは、サポートを求める顧客のた...
- 質問115 Microsoft Excel ファイルから Microsoft Dataverse にデータを...
- 質問116 企業は Power Apps キャンバス アプリを使用して情報を入力しま...
- 質問117 RevReceivedという名前のページを含むPower Blレポートがありま...
- 質問118 会社は、Microsoft Excelワークブックを使用して、統合された販...
- 質問119 A business uses a form to collect information. You create a ...
- 質問120 Power Apps アプリの各タイプをその機能に合わせます。 答えるに...
- 質問121 Power BIレポートを作成しています。 レポートに使用できるフィ...
- 質問122 あなたは会社のPowerVirtualAgentsチャットボットを作成していま...
- 質問123 ある会社には、おもちゃを販売するオンラインストアがあります。
- 質問124 手順:次の各ステートメントについて、ステートメントが真の場合
- 質問125 ユーザー 1 は、会社用に複数の Power Bl ダッシュボードを作成...
- 質問126 Microsoft Flowを使用して、会社の製品について人々が言って...
- 質問127 ある企業が Dataverse の機能を評価しています。 次の各文につい...
- 質問128 ある企業は、従業員が顧客の注文を記録するためのモデル駆動型ア
- 質問129 ある企業は、従業員を支援するために Power Virtual Agents チャ...
- 質問130 Power Automate フローを作成しています。 Microsoft Excel Azur...
- 質問131 企業向けに Copilot Studio 副操縦士を開発しています。 次の各...
- 質問132 あなたは大手衣料品会社の小売ディレクターです。毎週、企業のYo...
- 質問133 ある企業は、個人の生産性を向上させるために、ユーザーに Power...
- 質問134 Power Automateフローを作成しています。 フローは、販売機会の...
- 質問135 ある会社は、PowerAutomateを使用してタスクを自動化することを...
- 質問136 Dynamics 365 Customer Engagementからのデータを表示するPower ...
- 質問137 ある企業は、Dynamics 565 Customer Service に Customer Engage...
- 質問138 ある企業は、Microsoft Power Platform コネクタを使用して、Pow...
- 質問139 会社のPower Virtual Agentsチャットボットを構築する必要があり...
- 質問140 チーム用のPowerBIビジュアライゼーションを構築しています。 次...
- 質問141 名刺リーダーと感情分析の事前構築されたAIモデルを使用して、ソ...
- 質問142 請負業者がプロジェクトに取り組む時間を提出できるようにするキ
- 質問143 ある会社は Dynamics 365 Sales を使用しています。次の要件があ...
- 質問144 Power VirtualAgentsチャットボットを作成します。 ボットを顧客...
- 質問145 各ツールをそのタスクに一致させます。回答するには、適切なツー
- 質問146 Power B1 サービスを使用して、共有されているレポートのビジュ...
- 質問147 診療所には、Common DataServiceを使用するモデル駆動型アプリが...
- 質問148 企業はPower Platformの実装を検討しています。 Power Appsポー...
- 質問149 Dynamics 365Salesを使用しています。 チームのPowerBIレポート...
- 質問150 「Start from dat」というラベルの付いたオプションを使用して、...
- 質問151 製造会社は、倉庫を管理するためのモデル駆動型アプリを構築して
- 質問152 会社がDynamics 365 Supply Chain Managementを使用しています。...
- 質問153 企業用の Power Pages Web サイトを作成しています。 ページを作...
- 質問154 会社がDynamics 365 Customer Serviceを使用しています。同社は...
- 質問155 ある会社がPowerPlatformを使用しています。 ユーザーが顧客デー...
- 質問156 会社のPowerVirtualAgentsチャットボットを作成します。チャット...
- 質問157 企業は、サードパーティのアプリケーションと電子メールによる承
- 質問158 You are creating a Power Automate solution. You need to sele...
- 質問159 会社は、コールセンターのすべてのスタッフに表示される画面にサ
- 質問160 ある企業は、Al Builder の事前構築モデルを使用してデータを強...
- 質問161 会社向けにモデル駆動型アプリを実装する予定です。従業員はアプ
- 質問162 企業は、従業員がより効率的に作業できるように、ビジネス向けの
- 質問163 ある会社が独立した著者向けに電子書籍を発行しています。 同社
- 質問164 ある会社は、MicrosoftDataverse環境を作成することを計画してい...
