- ホーム
- Microsoft
- PL-100J - Microsoft Power Platform App Maker (PL-100日本語版)
- Microsoft.PL-100J.v2024-05-29.q127
- 質問36
有効的なPL-100J問題集はJPNTest.com提供され、PL-100J試験に合格することに役に立ちます!JPNTest.comは今最新PL-100J試験問題集を提供します。JPNTest.com PL-100J試験問題集はもう更新されました。ここでPL-100J問題集のテストエンジンを手に入れます。
PL-100J問題集最新版のアクセス
「279問、30% ディスカウント、特別な割引コード:JPNshiken」
コールセンターのマネージャーは、着信を監視します。マネージャーは、カスタムビューを使用して、電話担当者のパフォーマンスを分析します。ビューには、「通話時間(分)」という名前のカスタムフィールドが含まれています。
コールセンターのマネージャーは、Excelスプレッドシートを上級管理職に毎日提示する必要があります。スプレッドシートには、さらなる傾向分析と是正措置のためのコールセンターのパフォーマンスが含まれている必要があります。
スプレッドシートを作成する必要があります。
順番に実行する必要がある4つのアクションはどれですか?回答するには、適切なアクションをアクションのリストから回答領域に移動し、正しい順序に並べます。

コールセンターのマネージャーは、Excelスプレッドシートを上級管理職に毎日提示する必要があります。スプレッドシートには、さらなる傾向分析と是正措置のためのコールセンターのパフォーマンスが含まれている必要があります。
スプレッドシートを作成する必要があります。
順番に実行する必要がある4つのアクションはどれですか?回答するには、適切なアクションをアクションのリストから回答領域に移動し、正しい順序に並べます。
正解:
Explanation:
Timeline Description automatically generated with low confidence
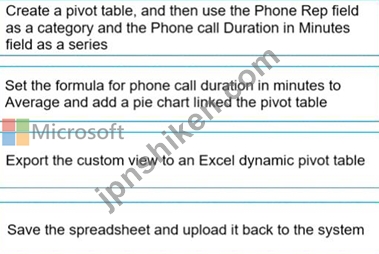
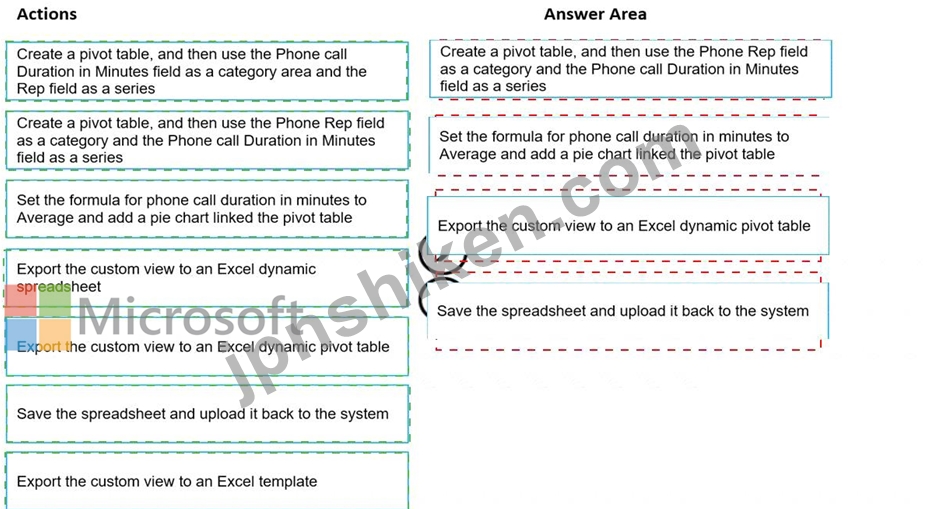
Step 1: Export the custom view to an Excel dynamic pivot table
You can export app data to an Office Excel PivotTable to see patterns and trends in data. An Excel PivotTable is a great way to summarize, analyze, explore, and present your app data.
Step 2: Create a pivot table, and then use the Phone Rep field as a category and the Phone call Duration in Minutes as field as series Step 3: Set the formula for phone call duration in minutes to Average and add a pie chart linked to the pivot table Step 4: Save the spreadsheet and upload it back to the system.
Reference:
https://docs.microsoft.com/en-us/powerapps/user/export-excel-pivottable

- 質問一覧「127問」
- 質問1 販売員のアクセシビリティのニーズを満たすために、アプリのデザ
- 質問2 複雑な計算を実行するには、キャンバスアプリコンポーネントライ
- 質問3 同社は、モデル駆動型アプリにマルチストリームインタラクティブ
- 質問4 会社は Microsoft Power Platform を使用しています。社内のすべ...
- 質問5 ある企業では、Microsoft Dataverse にステータスが「新規」の複...
- 質問6 キャンバス アプリを作成します。アプリチェッカーを実行してア
- 質問7 会社には 10 の販売地域があります。各営業担当者は 1 つの地域...
- 質問8 注:この質問は、同じシナリオを提示する一連の質問の一部です。
- 質問9 User1の問題を解決する必要があります。 何を使うべきですか?回...
- 質問10 原材料の在庫要件を満たすソリューションを実装する必要がありま
- 質問11 会社は Power Apps を使用しています。この会社には、Microsoft ...
- 質問12 会社には、顧客アカウントデータを格納するCommon DataServiceカ...
- 質問13 ユーザーが Microsoft Dataverse リード レコードを作成するとき...
- 質問14 管理されていないソリューションの一部として複数のアプリを作成
- 質問15 キャンバス アプリを大幅に変更します。 新しいアプリのバージョ...
- 質問16 サービス会社用のキャンバス アプリを作成します。 ツリー ビュ...
- 質問17 会社は Power Apps と Microsoft Data verse を使用しています。...
- 質問18 ある会社が、サービス担当者がオンサイトのクライアント訪問に関
- 質問19 PowerBIデスクトップを使用して容量計画ダッシュボードを作成し...
- 質問20 製造会社の生産ラインアプリメーカーは、SQLデータベースで利用...
- 質問21 あなたは銀行向けのアプリを設計しています。アプリで次のエンテ
- 質問22 注:この質問は、同じシナリオを提示する一連の質問の一部です。
- 質問23 必要な機能に応じた設計アプローチを選択する必要があります。
- 質問24 会社はキャンバス アプリを使用しています。アプリの最後に公開
- 質問25 企業は、マーケティング キャンペーンのパフォーマンス レポート...
- 質問26 同僚がキャンバスアプリを作成します。 キャンバスアプリには次
- 質問27 複数の画面を持つアプリを作成します。 テストユーザーは、各画
- 質問28 ある会社では Microsoft Power Apps を使用しています。 Microso...
- 質問29 注:この質問は、同じシナリオを提示する一連の質問の一部です。
- 質問30 PowerPlatform環境内でキャンバスアプリを作成します。 他のユー...
- 質問31 TailwindTradersにアプリを提供する必要があります。 あなたは何...
- 質問32 ある企業は、Microsoft Power Platform と Microsoft Teams を使...
- 質問33 企業は複数のコミュニティに製品を提供しています。同社は、Comm...
- 質問34 会社は Power Apps を使用しています。モデル駆動型アプリ フォ...
- 質問35 キャンバス アプリを作成します。アプリの現在のバージョンは 16...
- 質問36 コールセンターのマネージャーは、着信を監視します。マネージャ
- 質問37 次の共通データサービスエンティティがあります:BusinessContra...
- 質問38 あなたは個人的な見解を作成します。 他のユーザーがビューにア
- 質問39 次のリソースを使用するキャンバス アプリを作成します。 * Powe...
- 質問40 ある企業は、Power Automate を使用して、リスクにさらされてい...
- 質問41 ある企業は、プロジェクトのステータス レポートを管理するアプ
- 質問42 ある会社は、複数のPowerAppsアプリを国際的な事業全体の複数の...
- 質問43 あなたはアプリとレポートの作成者です。組織内の2つの部門に視
- 質問44 注:この質問は、同じシナリオを提示する一連の質問の一部です。
- 質問45 注:この質問は、同じシナリオを提示する一連の質問の一部です。
- 質問46 企業は、マーケティング キャンペーンのパフォーマンス レポート...
- 質問47 販売要件を満たすようにシステムを構成する必要があります。 あ
- 質問48 社内のユーザーは、次のキャンバス アプリを使用して、マーケテ
- 質問49 あなたは会社用のキャンバス アプリを作成しています。 アプリは...
- 質問50 ある会社が、技術者が使用する新しいアプリを作成しています。
- 質問51 ある企業は Microsoft Power Platform を使用しています。同社は...
- 質問52 会社は、MicrosoftDataverseテーブルを使用するアプリを作成しま...
- 質問53 あなたは失われた売上のためにアプリにロジックを実装する必要が
- 質問54 あなたはホテルのアプリデザイナーです。 ホテルは、ハウスキー
- 質問55 ある企業は、小売店のオンサイト検査と監査の統合を支援するため
- 質問56 自動車会社は Power Apps を使用しています。同社はモデル駆動型...
- 質問57 アプリがUser2とUser3のニーズをサポートし、本番環境のデプロイ...
- 質問58 タイムトラッキングアプリでユーザーの問題を解決する必要があり
- 質問59 料理教室用のデータ モデルを設計する必要があります。 何を使え...
- 質問60 ある会社が、カスタマーサービスチーム向けにPowerAppsアプリを...
- 質問61 あなたは倉庫で働いています。さまざまなスタッフが使用する実地
- 質問62 新しいレシピのアイデアを収集するチャットボットを設計して配布
- 質問63 キャンバスアプリを作成しています。 アプリがオフラインのとき
- 質問64 ある企業は Microsoft Dataverse を使用して従業員の休暇申請デ...
- 質問65 要件を満たすようにシステムを構成する必要があります。 何を使
- 質問66 モデル駆動型アプリを作成しています。 関連レコードのデータを
- 質問67 注:この質問は、同じシナリオを提示する一連の質問の一部です。
- 質問68 ある企業は、単一の Microsoft Dataverse 環境で Power Apps を...
- 質問69 企業は、公開されている Web サービスからのデータを使用します...
- 質問70 会社は Microsoft Power Platform を使用しています。コンポーネ...
- 質問71 ある会社では Power Apps を使用しています。新しいモデル駆動型...
- 質問72 購読者の注文に対するソリューションを作成する必要があります。
- 質問73 Microsoft Teams チャネルで従業員からアイデアを受け取ります。...
- 質問74 ある会社では Microsoft Teams を使用しています。同僚がチャッ...
- 質問75 大学のマーケティング活動をサポートするには、レポートを実装す
- 質問76 Common DataServiceデータベースに接続するキャンバスアプリを作...
- 質問77 Power Automate クラウド フローを作成しています。 フロー内の...
- 質問78 インサイド セールス スタッフは、セールス プロセスに 3 つのモ...
- 質問79 企業は、運用環境で Microsoft Power Platform を使用しています...
- 質問80 コンピューターストアで技術者向けのキャンバスアプリを作成しま
- 質問81 ユーザーが既存のアカウントのリストを作成および編集できるモデ
- 質問82 あなたは、従業員の休暇を追跡するアプリをデザインしました。従
- 質問83 製品に関するデータを2つのMicrosoftExcelワークシートに保存し...
- 質問84 注: この質問は、同じシナリオを示す一連の質問の一部です。この...
- 質問85 注:この質問は、同じシナリオを提示する一連の質問の一部です。
- 質問86 学生の出席要件を実装する必要があります。 何を使えばいいので
- 質問87 アカウントのリストを表示するキャンバスアプリを作成しています
- 質問88 開発環境でソリューションの一部としてカスタム テーブルを作成
- 質問89 市の建築部門の検査官は Microsoft Teams チャネルを使用し、検...
- 質問90 Accountエンティティにカスタムフィールドを作成します。 TeamA...
- 質問91 会社には、卸売と小売の部門があります。 製造元は、ユーザーがM...
- 質問92 製品とその色のリストを保存する必要があります。次の要素を含む
- 質問93 開発環境でソリューションの一部としてカスタム テーブルを作成
- 質問94 企業の顧客サービス チームは、モデル駆動型アプリを使用して顧
- 質問95 会社は Power Automate を使用しています。A と B という名前の ...
- 質問96 会社は Power Apps と Microsoft Dataverse を使用しています。 ...
- 質問97 会社はモデル駆動型アプリを使用しています。 PowerBI販売レポー...
- 質問98 組織のエンジニアは、国際的な製品ショーに参加することを計画し
- 質問99 あなたは会社のためにいくつかの新しい Microsoft Power Platfor...
- 質問100 ユーザーが何千ものレコードを検索できるキャンバス アプリを設
- 質問101 会社は販売注文をMicrosoftExcelワークブックに保存します。同社...
- 質問102 Microsoft Dynamics 365 Sales を使用しています。 ビジネス プ...
- 質問103 モデル駆動型アプリのダッシュボードを設計しています。 ユーザ
- 質問104 あなたは、新しいアプリのデータ モデルを設計しています。アプ
- 質問105 ある会社では Power Apps を使用しています。会社は、次の項目を...
- 質問106 Test Studioを使用して、PowerAppsキャンバスアプリをテストして...
- 質問107 Power Automateフロー、環境変数、およびモデル駆動型アプリを含...
- 質問108 企業は Microsoft Power Platform を使用しています。ユーザーは...
- 質問109 注:この質問は、同じシナリオを提示する一連の質問の一部です。
- 質問110 管理者は、販売員のみが使用するダッシュボードを作成して展開す
- 質問111 キャンバス アプリを作成しています。 少量の表形式データはアプ...
- 質問112 外部データソースから表形式のデータを読み込む複数ページのキャ
- 質問113 新入社員をオンボーディングするためのモデル駆動型アプリを作成
- 質問114 注:この質問は、同じシナリオを提示する一連の質問の一部です。
- 質問115 衣料品の小売業者は、MicrosoftTeamsでPowerVirtualAgentsチャッ...
- 質問116 RunningTotalという名前のグローバル変数の値を5に設定し、MainS...
- 質問117 キャンバスアプリを作成します。 社内の他の人がアプリを利用で
- 質問118 PowerAutomateフローを作成しています。 さまざまな色属性を持つ...
- 質問119 保険ブローカーは、カスタム テーブルを備えた Microsoft Datave...
- 質問120 モバイルアプリを作成する必要があります。 どのタイプのアプリ
- 質問121 Microsoft SharePointリストを使用して、顧客に関する情報を記録...
- 質問122 注:この質問は、同じシナリオを提示する一連の質問の一部です。
- 質問123 SalesLogからJobSetupエンティティにデータを移動するためのフロ...
- 質問124 会社は、2つのSQLServer環境と2つのCommonDataService環境を使用...
- 質問125 ソリューション資産を作成する必要があります。 ビジュアライゼ
- 質問126 会社のPowerBIレポートを作成しています。 Power BIレポートには...
- 質問127 企業は、すべてのアクセシビリティ、コンプライアンス、およびセ
