- ホーム
- Microsoft
- PL-100J - Microsoft Power Platform App Maker (PL-100日本語版)
- Microsoft.PL-100J.v2024-03-12.q117
- 質問16
有効的なPL-100J問題集はJPNTest.com提供され、PL-100J試験に合格することに役に立ちます!JPNTest.comは今最新PL-100J試験問題集を提供します。JPNTest.com PL-100J試験問題集はもう更新されました。ここでPL-100J問題集のテストエンジンを手に入れます。
PL-100J問題集最新版のアクセス
「279問、30% ディスカウント、特別な割引コード:JPNshiken」
会社のPowerBIレポートを作成しています。
Power BIレポートには、PowerBIサービスの会社のパフォーマンスメトリックを表示する必要があります。レポートには、ビジュアライゼーションに3つのフィールドを含める必要があります。レポートのデータはデータセットに存在します。
同社はチームミーティング中に大きなテレビ画面にレポートを表示します。
レポートを作成する必要があります。
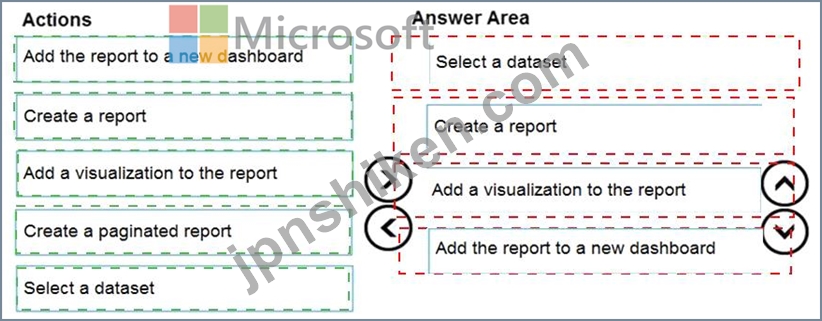
どの4つのアクションを順番に実行する必要がありますか?回答するには、適切なアクションをアクションのリストから回答に移動し、正しい順序に並べます。

Power BIレポートには、PowerBIサービスの会社のパフォーマンスメトリックを表示する必要があります。レポートには、ビジュアライゼーションに3つのフィールドを含める必要があります。レポートのデータはデータセットに存在します。
同社はチームミーティング中に大きなテレビ画面にレポートを表示します。
レポートを作成する必要があります。
どの4つのアクションを順番に実行する必要がありますか?回答するには、適切なアクションをアクションのリストから回答に移動し、正しい順序に並べます。
正解:
Explanation
Graphical user interface, text, application, chat or text message Description automatically generated
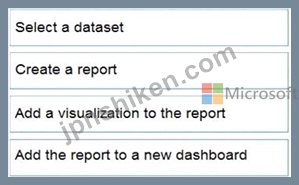
Box 1: Select a dataset
Sign in to your Power BI online account, or sign up, if you don't have an account yet.
Open the Power BI service.
Get some data and open it in report view.
Box 2: Create a report
Use that data to create visualizations and save it as a report.
Box 3: Add a visualization to the report
Box 4: Add the report to a new dashboard
Visualizations (known as visuals for short) display insights that have been discovered in the data. A Power BI report might have a single page with one visual or it might have pages full of visuals. In the Power BI service, visuals can be pinned from reports to dashboards.
Reference:
https://docs.microsoft.com/en-us/power-bi/fundamentals/service-get-started
https://docs.microsoft.com/en-us/power-bi/visuals/power-bi-report-visualizations

- 質問一覧「117問」
- 質問1 SharePowerUsersとShareJimSmithの展示に示されているように、Bi...
- 質問2 開発環境でソリューションの一部としてカスタム テーブルを作成
- 質問3 モデル駆動型アプリのダッシュボードを設計しています。 ユーザ
- 質問4 ユーザーがMicrosoftExcelテンプレートを使用してデータを分析で...
- 質問5 管理されていないソリューションの一部として複数のアプリを作成
- 質問6 自動車会社は Power Apps を使用しています。同社はモデル駆動型...
- 質問7 運用管理者から要求された変更を実装する必要があります。 どの
- 質問8 モバイルアプリを以前のバージョンにロールバックする必要があり
- 質問9 ある会社は、複数のPowerAppsアプリを国際的な事業全体の複数の...
- 質問10 ある企業は財務ファイルを Microsoft SharePoint ドキュメント ...
- 質問11 レポートを作成するには、Microsoft Power BI Desktop を使用し...
- 質問12 ある企業は Power Apps と Microsoft Dataverse を使用していま...
- 質問13 既存のPowerApps環境があります。 環境用のCommonDataServiceデ...
- 質問14 週次レポート アプリをキャンバス アプリとして作成します。アプ...
- 質問15 ある会社では Microsoft Teams を使用しています。同僚がチャッ...
- 質問16 会社のPowerBIレポートを作成しています。 Power BIレポートには...
- 質問17 企業は、PowerAutomateとPowerAppsを使用してビジネスプロセスを...
- 質問18 州計画部門は、人口統計データをローカルの SQL Server データベ...
- 質問19 ある自転車店では、Microsoft Dataverse を使用して、自転車のレ...
- 質問20 フードバンク通知を作成する必要があります。 どの 4 つのアクシ...
- 質問21 あなたはホテルのアプリデザイナーです。 ホテルは、ハウスキー
- 質問22 インストラクターの問題を解決し、同じ問題が再発しないようにす
- 質問23 Microsoft SharePointリストを使用して、顧客に関する情報を記録...
- 質問24 ある会社が、Microsoft PowerPlatformに新しいワーカーをオンボ...
- 質問25 注:この質問は、同じシナリオを提示する一連の質問の一部です。
- 質問26 注:この質問は、同じシナリオを提示する一連の質問の一部です。
- 質問27 Test Studioを使用して、PowerAppsキャンバスアプリをテストして...
- 質問28 注:この質問は、同じシナリオを提示する一連の質問の一部です。
- 質問29 あなたは診療所のアプリビルダーです。診療所は、活動を使用して
- 質問30 ある会社は、MicrosoftTeamsとMicrosoftPowerPlatformテクノロジ...
- 質問31 あなたは個人的な見解を作成します。 他のユーザーがビューにア
- 質問32 パッケージを提供する会社のキャンバスアプリを作成しています。
- 質問33 ある会社では Microsoft Power Apps を使用しています。 Microso...
- 質問34 ある企業は Microsoft Teams と Microsoft 365 を使用しています...
- 質問35 会社には、顧客アカウントデータを格納するCommon DataServiceカ...
- 質問36 あなたは、新しいアプリのデータ モデルを設計しています。アプ
- 質問37 Common Data Serviceデータベースにエンティティを作成して、販...
- 質問38 コードを使用せずにモデル駆動型アプリを作成する必要があります
- 質問39 ある企業は Microsoft Power Platform を使用しています。同社は...
- 質問40 製品に関するデータを2つのMicrosoftExcelワークシートに保存し...
- 質問41 テスト中に見つかった問題を解決する必要があります。 どのオプ
- 質問42 注:この質問は、同じシナリオを提示する一連の質問の一部です。
- 質問43 PowerPlatformソリューションを作成します。ソリューションデー...
- 質問44 あなたは失われた売上のためにアプリにロジックを実装する必要が
- 質問45 タイムトラッキングアプリの要件を満たす必要があります。 どの
- 質問46 会社は Power Automate を使用しています。A と B という名前の ...
- 質問47 製品とその色のリストを保存する必要があります。次の要素を含む
- 質問48 学生の出席要件を実装する必要があります。 何を使えばいいので
- 質問49 モデル駆動型アプリの対話型レポートを設計しています。レポート
- 質問50 Contoso, Ltd 向けに Microsoft Power Platform ソリューション...
- 質問51 ある会社が、サービス担当者がオンサイトのクライアント訪問に関
- 質問52 ある企業は、Microsoft Power Platform と Microsoft Teams を使...
- 質問53 郵便サービスは、Microsoftデータベースに基づくシステムを使用...
- 質問54 販売員のアクセシビリティのニーズを満たすために、アプリのデザ
- 質問55 アカウントのリストを表示するキャンバスアプリを作成しています
- 質問56 新しいソリューションパブリッシャーを作成し、パブリッシャープ
- 質問57 ある会社では Microsoft Power Apps を使用しています。 Microso...
- 質問58 あなたは法務サービス組織の技術アシスタントです。同社はShareP...
- 質問59 PowerPlatform環境内でキャンバスアプリを作成します。 他のユー...
- 質問60 要件を満たすようにシステムを構成する必要があります。 何を使
- 質問61 ある会社では Microsoft Power Apps を使用しています。 Microso...
- 質問62 ある会社には500の製品があります。各製品は製品IDによって参照...
- 質問63 企業は Microsoft Power Platform を使用しています。ユーザーは...
- 質問64 ある企業は Microsoft Dataverse を使用して従業員の休暇申請デ...
- 質問65 ある企業は Power Automate を使用しています。 この会社では、...
- 質問66 ある会社では Power Apps を使用しています。同社は展示会でタブ...
- 質問67 あなたはアプリとレポートの作成者です。組織内の2つの部門に視
- 質問68 JobSetupアプリのデータソースに接続する必要があります。 あな...
- 質問69 あなたは宅配会社向けのアプリを開発しています。配信チームのメ
- 質問70 要件を満たすようにアプリを構成する必要があります。 どのオブ
- 質問71 注:この質問は、同じシナリオを提示する一連の質問の一部です。
- 質問72 コールセンターのマネージャーは、着信を監視します。マネージャ
- 質問73 キャンバス アプリを作成します。アプリチェッカーを実行してア
- 質問74 会社には 10 の販売地域があります。各営業担当者は 1 つの地域...
- 質問75 モバイルアプリを作成する必要があります。 どのタイプのアプリ
- 質問76 複数の画面を持つキャンバス アプリを設計します。各画面には複
- 質問77 Power Apps Maker ポータルを使用して、新しい Common Data Serv...
- 質問78 ある会社は、単一の Microsoft Dataverse 環境で Power Apps を...
- 質問79 複雑な計算を実行するには、キャンバスアプリコンポーネントライ
- 質問80 あなたは会社のためにいくつかの新しい Microsoft Power Platfor...
- 質問81 キャンバス アプリを作成します。 アプリにスクリーン リーダー...
- 質問82 アプリとソリューションの最初のバージョンを2020年11月1日に公...
- 質問83 LEST 環境では、基本的なユーザー セキュリティ ロールを持って...
- 質問84 開発環境でソリューションの一部としてカスタム テーブルを作成
- 質問85 ソリューションの機能を実装する必要があります。 各機能にどのP...
- 質問86 会社は Power Apps と Microsoft Data verse を使用しています。...
- 質問87 ステータスレポートを送信するための機能を構成する必要がありま
- 質問88 注:この質問は、同じシナリオを提示する一連の質問の一部です。
- 質問89 ある企業は、販売業務のコラボレーションに役立つ複数の Power A...
- 質問90 企業は、マーケティング キャンペーンのパフォーマンス レポート...
- 質問91 会社は、MicrosoftDataverseテーブルを使用するアプリを作成しま...
- 質問92 会社は Power Apps を使用しています。 同社は、次のソースに接...
- 質問93 会社は Power Apps と Microsoft Dataverse を使用しています。...
- 質問94 あなたは、従業員の休暇を追跡するアプリをデザインしました。従
- 質問95 Common DataServiceデータベースに接続するキャンバスアプリを作...
- 質問96 注:この質問は、同じシナリオを提示する一連の質問の一部です。
- 質問97 組織のエンジニアは、国際的な製品ショーに参加することを計画し
- 質問98 ユーザーが数千のレコードを検索できるようにキャンバス アプリ
- 質問99 ある企業は、Power Automate を使用して、リスクにさらされてい...
- 質問100 キャンバス アプリを作成しています。 少量の表形式データはアプ...
- 質問101 注:この質問は、同じシナリオを提示する一連の質問の一部です。
- 質問102 3つのモデル駆動型アプリ、ビジネスプロセスフロー、およびスケ
- 質問103 営業担当者向けのモデル駆動型アプリを作成します。 ユーザーは
- 質問104 タイムトラッキングアプリでユーザーの問題を解決する必要があり
- 質問105 複数の画面を持つアプリを作成します。 テストユーザーは、各画
- 質問106 注:この質問は、同じシナリオを提示する一連の質問の一部です。
- 質問107 企業の顧客サービス チームは、モデル駆動型アプリを使用して顧
- 質問108 キャンバスアプリを作成します。 社内の他の人がアプリを利用で
- 質問109 インサイド セールス スタッフは、セールス プロセスに 3 つのモ...
- 質問110 TailwindTradersにアプリを提供する必要があります。 あなたは何...
- 質問111 企業向けにモデル駆動型アプリを作成するとします。このアプリは
- 質問112 会社は Microsoft Power Platform を使用しています。コンポーネ...
- 質問113 データ ソースの読み取りと書き込みを行うキャンバス アプリを作...
- 質問114 アプリがUser2とUser3のニーズをサポートし、本番環境のデプロイ...
- 質問115 市の建築部門の検査官は Microsoft Teams チャネルを使用し、検...
- 質問116 PowerAutomateフローを作成しています。 さまざまな色属性を持つ...
- 質問117 販売要件を満たすようにシステムを構成する必要があります。 あ
