- ホーム
- Microsoft
- PL-100J - Microsoft Power Platform App Maker (PL-100日本語版)
- Microsoft.PL-100J.v2023-09-29.q109
- 質問102
有効的なPL-100J問題集はJPNTest.com提供され、PL-100J試験に合格することに役に立ちます!JPNTest.comは今最新PL-100J試験問題集を提供します。JPNTest.com PL-100J試験問題集はもう更新されました。ここでPL-100J問題集のテストエンジンを手に入れます。
PL-100J問題集最新版のアクセス
「279問、30% ディスカウント、特別な割引コード:JPNshiken」
コールセンターのマネージャーは、着信を監視します。マネージャーは、カスタムビューを使用して、電話担当者のパフォーマンスを分析します。ビューには、「通話時間(分)」という名前のカスタムフィールドが含まれています。
コールセンターのマネージャーは、Excelスプレッドシートを上級管理職に毎日提示する必要があります。スプレッドシートには、さらなる傾向分析と是正措置のためのコールセンターのパフォーマンスが含まれている必要があります。
スプレッドシートを作成する必要があります。
順番に実行する必要がある4つのアクションはどれですか?回答するには、適切なアクションをアクションのリストから回答領域に移動し、正しい順序に並べます。

コールセンターのマネージャーは、Excelスプレッドシートを上級管理職に毎日提示する必要があります。スプレッドシートには、さらなる傾向分析と是正措置のためのコールセンターのパフォーマンスが含まれている必要があります。
スプレッドシートを作成する必要があります。
順番に実行する必要がある4つのアクションはどれですか?回答するには、適切なアクションをアクションのリストから回答領域に移動し、正しい順序に並べます。
正解:
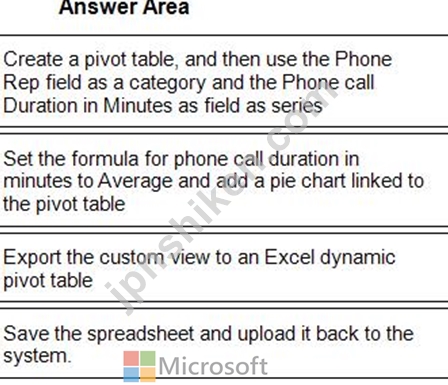
1 - Create a pivot table, and then use the Phone Rep field as a category and the Phone call Duration in Minutes as field as series
2 - Set the formula for phone call duration in minutes to Average and add a pie chart linked to the pivot table
3 - Export the custom view to an Excel dynamic pivot table
4 - Save the spreadsheet and upload it back to the system.
Reference:
https://docs.microsoft.com/en-us/powerapps/user/export-excel-pivottable

- 質問一覧「109問」
- 質問1 アカウントのリストを表示するキャンバスアプリを作成しています
- 質問2 ある会社は、単一の Microsoft Dataverse 環境で Power Apps を...
- 質問3 会社は販売注文をMicrosoftExcelワークブックに保存します。同社...
- 質問4 会社はモデル駆動型アプリを使用しています。 PowerBI販売レポー...
- 質問5 ストア用のキャンバスアプリを作成します。 ロゴはアプリの背景
- 質問6 注:この質問は、同じシナリオを提示する一連の質問の一部です。
- 質問7 あなたは会社のためにいくつかの新しい Microsoft Power Platfor...
- 質問8 注:この質問は、同じシナリオを提示する一連の質問の一部です。
- 質問9 ユーザーがMicrosoftExcelテンプレートを使用してデータを分析で...
- 質問10 ある企業は、プロジェクトのステータス レポートを管理するアプ
- 質問11 ある会社がキャンバスアプリを作成しています。 ユーザーは、連
- 質問12 計算に複数の入力を使用するキャンバスアプリがあります。 Test ...
- 質問13 ある会社では Power Apps を使用しています。会社は、次の項目を...
- 質問14 複雑な計算を実行するには、キャンバスアプリコンポーネントライ
- 質問15 ある企業は Microsoft Dataverse を使用して従業員の休暇申請デ...
- 質問16 開発環境でソリューションの一部としてカスタム テーブルを作成
- 質問17 あなたはアプリメーカーです。キャンバスアプリを作成しています
- 質問18 会社は Power Apps と Microsoft Dataverse を使用しています。 ...
- 質問19 Microsoft Dataverse レコードのリスト内の各項目の列を更新する...
- 質問20 管理されていないソリューションの一部として複数のアプリを作成
- 質問21 SharePowerUsersとShareJimSmithの展示に示されているように、Bi...
- 質問22 JobSetupアプリのデータソースに接続する必要があります。 あな...
- 質問23 Common DataServiceデータベースに接続するキャンバスアプリを作...
- 質問24 MicrosoftSharePointドキュメントライブラリ内のファイルを処理...
- 質問25 ある大手建設会社には 120 の部門があります。各部門には Micros...
- 質問26 ある企業は、小売店のオンサイト検査と監査の統合を支援するため
- 質問27 あなたはアプリとレポートの作成者です。組織内の2つの部門に視
- 質問28 フードバンク通知を作成する必要があります。 どの 4 つのアクシ...
- 質問29 あなたはアプリメーカーです。 デフォルトのソリューションの一
- 質問30 モデル駆動型アプリのダッシュボードを設計しています。 ユーザ
- 質問31 ある会社には何百もの倉庫があります。あなたは会社の配送部門向
- 質問32 製品とその色のリストを保存する必要があります。次の要素を含む
- 質問33 販売員のアクセシビリティのニーズを満たすために、アプリのデザ
- 質問34 大学のマーケティング活動をサポートするには、レポートを実装す
- 質問35 ある会社が、Microsoft PowerPlatformに新しいワーカーをオンボ...
- 質問36 必要なメールを地域マネージャーに送信するためのフローを作成す
- 質問37 PowerPlatformソリューションを作成します。ソリューションデー...
- 質問38 ある企業は Power Apps と Microsoft Dataverse を使用していま...
- 質問39 あなたは大学のアプリ メーカーです。学生登録用のアプリを作成
- 質問40 アプリケーションのすべてのアプリコンポーネントをTailwindTrad...
- 質問41 アプリがUser2とUser3のニーズをサポートし、本番環境のデプロイ...
- 質問42 会社には、卸売と小売の部門があります。 製造元は、ユーザーがM...
- 質問43 ある企業は Microsoft Teams と Microsoft 365 を使用しています...
- 質問44 従業員ディレクトリ キャンバス アプリを作成しています。アプリ...
- 質問45 ある企業では、Microsoft Dataverse にステータスが「新規」の複...
- 質問46 あなたはホテルのアプリデザイナーです。 ホテルは、ハウスキー
- 質問47 会社は Microsoft Power Platform を使用しています。社内のすべ...
- 質問48 ユーザーが既存のアカウントのリストを作成および編集できるモデ
- 質問49 コンピューターストアで技術者向けのキャンバスアプリを作成しま
- 質問50 営業担当者向けのモデル駆動型アプリを作成します。 ユーザーは
- 質問51 注:この質問は、同じシナリオを提示する一連の質問の一部です。
- 質問52 要件を満たすようにシステムを構成する必要があります。 何を使
- 質問53 複数の画面を持つアプリを作成します。 テストユーザーは、各画
- 質問54 ある会社が、技術者が使用する新しいアプリを作成しています。
- 質問55 PowerBIデスクトップを使用して容量計画ダッシュボードを作成し...
- 質問56 あなたは診療所のアプリビルダーです。診療所は、活動を使用して
- 質問57 開発環境でソリューションの一部としてカスタム テーブルを作成
- 質問58 テスト中に見つかった問題を解決する必要があります。 どのオプ
- 質問59 注:この質問は、同じシナリオを提示する一連の質問の一部です。
- 質問60 顧客にコンピューター ハードウェアを提案する「Hardware Order...
- 質問61 会社が新しい Microsoft 365 テナントに移行しています。古い Mi...
- 質問62 製造会社の生産ラインアプリメーカーは、SQLデータベースで利用...
- 質問63 Microsoft SharePointリストを使用して、顧客に関する情報を記録...
- 質問64 企業は、すべてのアクセシビリティ、コンプライアンス、およびセ
- 質問65 企業の顧客サービス チームは、モデル駆動型アプリを使用して顧
- 質問66 ある会社は、MicrosoftTeamsとMicrosoftPowerPlatformテクノロジ...
- 質問67 ステータスレポートを送信するための機能を構成する必要がありま
- 質問68 開発環境でソリューションの一部としてカスタム テーブルを作成
- 質問69 管理者は、販売員のみが使用するダッシュボードを作成して展開す
- 質問70 企業は、運用環境で Microsoft Power Platform を使用しています...
- 質問71 キャンバスアプリを作成しています。 エンドユーザーに選択肢の
- 質問72 学生の出席要件を実装する必要があります。 何を使えばいいので
- 質問73 Power Automateを使用して、自動化されたフローを作成します。フ...
- 質問74 Microsoft Teams で Power Virtual Agents チャットボットを設計...
- 質問75 注:この質問は、同じシナリオを提示する一連の質問の一部です。
- 質問76 ある会社は、複数のPowerAppsアプリを国際的な事業全体の複数の...
- 質問77 会社は Power Automate を使用しています。A と B という名前の ...
- 質問78 注:この質問は、同じシナリオを提示する一連の質問の一部です。
- 質問79 ある企業は、販売業務のコラボレーションに役立つ複数の Power A...
- 質問80 衣料品の小売業者は、MicrosoftTeamsでPowerVirtualAgentsチャッ...
- 質問81 キャンバスアプリを作成します。 ユーザーは、現在どのフィール
- 質問82 キャンバスアプリを作成します。 社内の他の人がアプリを利用で
- 質問83 会社は Power Apps を使用しています。モデル駆動型アプリ フォ...
- 質問84 企業は、公開されている Web サービスからのデータを使用します...
- 質問85 会社は、別のキャンバスPowerAppsアプリからエクスポートされたP...
- 質問86 モデル駆動型アプリの対話型レポートを設計しています。レポート
- 質問87 企業は Microsoft Power Platform を使用しています。ユーザーは...
- 質問88 あなたは失われた売上のためにアプリにロジックを実装する必要が
- 質問89 会社は Power Apps を使用しています。会社には、パートナー組織...
- 質問90 3つのモデル駆動型アプリ、ビジネスプロセスフロー、およびスケ
- 質問91 コードを使用せずにモデル駆動型アプリを作成する必要があります
- 質問92 PowerPlatform環境内でキャンバスアプリを作成します。 他のユー...
- 質問93 PowerAutomateフローを作成しています。 さまざまな色属性を持つ...
- 質問94 複数の画面を持つアプリを作成します。 テストユーザーは、各画
- 質問95 次の共通データサービスエンティティがあります:BusinessContra...
- 質問96 Contoso, Ltd 向けに Microsoft Power Platform ソリューション...
- 質問97 市の建築部門の検査官は Microsoft Teams チャネルを使用し、検...
- 質問98 注:この質問は、同じシナリオを提示する一連の質問の一部です。
- 質問99 キャンバスアプリを作成しています。画面にスコープされた変数を
- 質問100 注:この質問は、同じシナリオを提示する一連の質問の一部です。
- 質問101 Accountエンティティにカスタムフィールドを作成します。 TeamA...
- 質問102 コールセンターのマネージャーは、着信を監視します。マネージャ
- 質問103 注:この質問は、同じシナリオを提示する一連の質問の一部です。
- 質問104 自動車会社は Power Apps を使用しています。同社はモデル駆動型...
- 質問105 外部データソースから表形式のデータを読み込む複数ページのキャ
- 質問106 企業向けにモデル駆動型アプリを作成するとします。このアプリは
- 質問107 Common Data Serviceデータベースにエンティティを作成して、販...
- 質問108 User1の問題を解決する必要があります。 何を使うべきですか?回...
- 質問109 あなたは銀行向けのアプリを設計しています。アプリで次のエンテ
