- ホーム
- Microsoft
- MB-300J - Microsoft Dynamics 365: Core Finance and Operations (MB-300日本語版)
- Microsoft.MB-300J.v2024-03-18.q167
- 質問20
有効的なMB-300J問題集はJPNTest.com提供され、MB-300J試験に合格することに役に立ちます!JPNTest.comは今最新MB-300J試験問題集を提供します。JPNTest.com MB-300J試験問題集はもう更新されました。ここでMB-300J問題集のテストエンジンを手に入れます。
MB-300J問題集最新版のアクセス
「390問、30% ディスカウント、特別な割引コード:JPNshiken」
会社は Dynamics 365 財務を実装します。
ユーザー受け入れテストを解決すると、ユーザーは一部のページでパフォーマンスの問題を観察します。
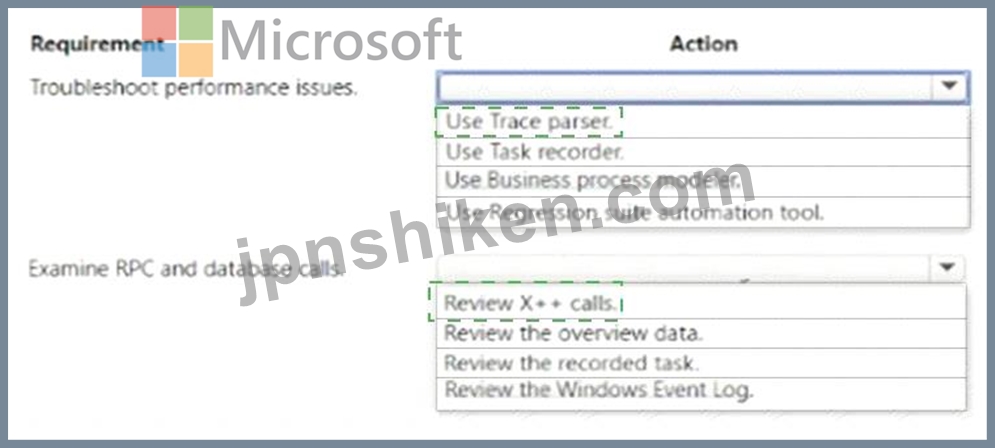
パフォーマンスの問題をトラブルシューティングし、リモート プロシージャ コール (RPC) とデータベース コールを調べる必要があります。
あなたは何をするべきか?回答するには、回答エリアで適切なオプションを選択します。
注: それぞれの正しい選択は 1 ポイントの価値があります。

ユーザー受け入れテストを解決すると、ユーザーは一部のページでパフォーマンスの問題を観察します。
パフォーマンスの問題をトラブルシューティングし、リモート プロシージャ コール (RPC) とデータベース コールを調べる必要があります。
あなたは何をするべきか?回答するには、回答エリアで適切なオプションを選択します。
注: それぞれの正しい選択は 1 ポイントの価値があります。
正解:
Explanation:
Box 1: Trace parser
You can diagnose issues and analyze performance by using Trace parser.
You can use the Trace parser to consume traces and analyze performance in your deployment. You can use the Trace Parser to find and diagnose various types of errors. You can also use the tool to visualize execution of X++ methods, as well as the execution call tree.
Box 2: Review X++ calls.
Trace Parser can help identify performance issues including long-running X++ methods, time-consuming SQL queries, or client server calls. Trace Parser consolidates information from multiple sources, such as remote procedure calls (RPCs) and Microsoft SQL Server, to provide an integrated view of application performance for a process. Trace Parser not only measures code execution, but also provides information about database execution times and may indicate performance issues due to caching.
Reference: https://learn.microsoft.com/en-us/dynamics365/fin-ops-core/dev-itpro/perf-test/trace-parser
https://global.hitachi-solutions.com/blog/erp-monitoring/

- 質問一覧「167問」
- 質問1 Lifecycle Service (LCS) を Azure DevOps と統合して、Dynamic ...
- 質問2 リージョナルマネージャーの問題の根本的な原因を特定する必要が
- 質問3 ある企業は、さまざまなワーク ストリームを部門ごとに 1 つのア...
- 質問4 検索結果で販売員がマンソンを表示できない理由を特定する必要が
- 質問5 Dynamics 365 for Finance and Operationsシステム管理者です。...
- 質問6 Dynamics 365 for Finance and Operations環境の規制順守に責任...
- 質問7 Dynamics AX 2012 R3からDynamics 365 for Finance and Operatio...
- 質問8 会社は Dynamics 365 Finance を実装しています。 新しいシステ...
- 質問9 組織は Dynamic 365 Finance を実装しています。 この組織は、Co...
- 質問10 あなたは、Contoso Entertainment System USA (USMF) の機能コン...
- 質問11 アカウント担当者用にシステムを構成する必要があります。 実行
- 質問12 ある企業は、今後 12 か月以内に Dynamics 365 Supply Chain Man...
- 質問13 注:この質問は、同じシナリオを提示する一連の質問の一部です。
- 質問14 ある会社がDynamics365FinanceとDynamics365カスタマーサービス...
- 質問15 Dynamics 365 Finance を実装しています。 次のユーザー要件があ...
- 質問16 あなたはContosoEntertainment System USA(USMF)の機能コンサ...
- 質問17 あなたはDynamics 365 Financeシステム管理者です。 アカウント...
- 質問18 製造ビジネス プロセスの問題に対処するには、テスト機能を実装
- 質問19 カスタマーサービス担当者が払い戻しリクエストを開始できること
- 質問20 会社は Dynamics 365 財務を実装します。 ユーザー受け入れテス...
- 質問21 セキュリティの役割と新しいプロセスに関する潜在的な問題を特定
- 質問22 あなたはContosoEntertainment System USA(USMF)の機能コンサ...
- 質問23 Dynamic 365 Finance を実装しています。 新しい請求仕訳帳が転...
- 質問24 データ管理者がタスクを実行するために必要なDynamics365コンポ...
- 質問25 ある会社がDynamics365Financeを実装しています。 会社は新しい...
- 質問26 ある会社は、二重書き込みを使用して、Dynamic 365 と Dynamic 3...
- 質問27 あなたはContosoEntertainment System USA(USMF)の機能コンサ...
- 質問28 現在、Dynamics 365 Finance のバージョン 10.0.2 を実行してい...
- 質問29 会社のユーザーにセキュリティロールを設定します。 可能な場合
- 質問30 注:この質問は、同じシナリオを提示する一連の質問の一部です。
- 質問31 Dynamics 36b Supply Chain Management を実装します。2,000 を...
- 質問32 会社はDynamics365 CustomerEngagementを使用しています。同社は...
- 質問33 注:この質問は、同じシナリオを提示する一連の質問の一部です。
- 質問34 企業は Dynamics 365 Finance と Dynamics 365 Supply Chain Man...
- 質問35 次のDynamics365Financeインスタンスがあります。 (Exhibit) 構...
- 質問36 どのMicrosoft機能がアクションを実行するかを特定する必要があ...
- 質問37 注:この質問は、同じシナリオを提示する一連の質問の一部です。
- 質問38 技術サービス注文リクエストが作成されたときにフローをトリガー
- 質問39 LibertyがContoso、Ltd.のビジネスプロセスを使用できることを確...
- 質問40 あなたは Dynamics 365 Finance を実装し、カスタマイズを構築し...
- 質問41 500 万を超えるレコードを新しい Dynamics 365 インスタンスに移...
- 質問42 デフォルトのExcelテンプレートの問題を解決する必要があります...
- 質問43 注: この質問は、同じシナリオを示す一連の質問の一部です。この...
- 質問44 Dynamics 365 Finance を実装しています。Excel 用 Microsoft Dy...
- 質問45 あなたはDynamics 365 Financeのシステム管理者です。 Dynamics ...
- 質問46 notification1 のアラート構成を構成する必要があります。 どの...
- 質問47 ある企業は、Dynamics 365 Supply Chain Management を使用して...
- 質問48 あなたはContosoEntertainment System USA(USMF)の機能コンサ...
- 質問49 会社は、Dynamics 365 for Finance and Operationsを実装してい...
- 質問50 会社は、Dynamics 365 for Finance and Operationsを実装し、ラ...
- 質問51 注:この質問は、同じシナリオを提示する一連の質問の一部です。
- 質問52 最初のExcelテンプレートにデータをインポートするためにセール...
- 質問53 クライアントは、稼働開始の準備をするために顧客を Dynamics 36...
- 質問54 あなたの会社は Dynamics 365 Finance にアップグレードしていま...
- 質問55 セールスストリートチームの代表者の要件を満たすようにシステム
- 質問56 あなたはDynamics 365 Financeのシステム管理者です。 ユーザー...
- 質問57 あなたはDynamics 365 Financeのシステム管理者です。 ユーザー...
- 質問58 ある企業は、グローバルな運営に Dynamics 365 Finance を使用し...
- 質問59 ある会社は、財務および運用アプリを使用しています。同社は、米
- 質問60 会社は、特定の住所を検索し、システムに存在する可能性のあるベ
- 質問61 Dynamics 365 Supply Chain Management を実装しています。 新し...
- 質問62 古いシステムから Dynamics 365 Finance に士気データを取り込む...
- 質問63 営業担当者から報告されたエラーの原因と理由をトラブルシューテ
- 質問64 注: この質問は、同じシナリオを示す一連の質問の一部です。この...
- 質問65 Dynamics AX 2009からDynamics 365 for Finance and Operations...
- 質問66 Dynamics 365 for Finance and Operations環境の新しい購入ソリ...
- 質問67 ある会社がDynamics365Financeを展開しています。 会社は、顧客...
- 質問68 会社には、Regression Suite自動テスト(RSAT)ツールで活用でき...
- 質問69 組織のDynamics 365 for Finance and Operations展開の使いやす...
- 質問70 ある会社が、倉庫内のディスプレイのPowerBIダッシュボードに倉...
- 質問71 会社は、Dynamics 365 for Finance and Operationsを実装してい...
- 質問72 注:この質問は、同じシナリオを提示する一連の質問の一部です。
- 質問73 アルペン スキー ハウス ソリューションに必要なチェーン アプリ...
- 質問74 ある会社が、レガシーシステムから財務および運用向けDynamics 3...
- 質問75 注:この質問は、同じシナリオを提示する一連の質問の一部です。
- 質問76 企業は Dynamics 365 Supply Chain Management を使用しています...
- 質問77 拡張をサポートする機能を特定する必要があります。 どの機能を
- 質問78 企業は Dynamics 365 Finance を実装しています。同社には、テス...
- 質問79 Dynamics 365 for Finance and Operations環境を管理します。 新...
- 質問80 Dynamic 365 Supply chain management にデータを移行する準備を...
- 質問81 要件を満たすセールス ストリート チーム アプリケーション用の...
- 質問82 あなたはContosoEntertainment System USA(USMF)の機能コンサ...
- 質問83 Dynamics 365 Finance を実装しています。 新しい固定資産が作成...
- 質問84 注:この質問は、同じシナリオを提示する一連の質問の一部です。
- 質問85 会社は、Dynamics 365 for Finance and Operationsを実装してい...
- 質問86 Fabrikam、Inc。という会社は、英国に事務所を開設する予定です...
- 質問87 ある企業が Dynamics 365 Finance を実装しています。 同社は 2 ...
- 質問88 Dynamics 365 Finance を実装しています。 ユーザー受け入れテス...
- 質問89 Dynamics 365 Finance を実装しています。 ビジネスの主要業績評...
- 質問90 あなたは Dynamic 365 Finance と Dynamics 365 supply Chain Ma...
- 質問91 企業は Dynamics 365 Finance を実装しています。 実装チームは...
- 質問92 注: この質問は、同じシナリオを示す一連の質問の一部です。この...
- 質問93 営業担当者のレポートデータの問題を解決する必要があります。
- 質問94 Dynamics 365 Finance でカスタム機能をサポートします。 あなた...
- 質問95 あなたの会社は、多くの部品サプライヤーが参加する会議に出席し
- 質問96 企業は Dynamics 365 Supply Chain Management を使用しています...
- 質問97 組織のDynamics 365ファイナンス展開の使いやすさを向上させたい...
- 質問98 あなたはContosoConsulting FR(FRSI)の機能コンサルタントです...
- 質問99 会社は、Finance and Operations アプリを実装しています。 必要...
- 質問100 あなたは Dynamics 365 for Finance and Operations システム管...
- 質問101 あなたはContosoEntertainment System USA(USMF)の機能コンサ...
- 質問102 ある会社は、Dynamics 365 Finance を使用して稼働する準備をし...
- 質問103 会社は、データ管理フレームワークを使用してデータをインポート
- 質問104 ある会社は、オンプレミスで cymes 365 Finance を実装していま...
- 質問105 会社は、Dynamics 365 for Finance and Operationsを実装してい...
- 質問106 Dynamics 365 for Finance and Operationsシステム管理者です。 ...
- 質問107 2 つの法人を持つ会社は、Dynamics 365 財務を実装しています。 ...
- 質問108 ExcelインスタンスをRelecloud実稼働インスタンスに接続する必要...
- 質問109 会社は Dynamics 365 Commerce を実装しています。 従業員は、次...
- 質問110 会社はDynamics365Financeを使用しています。 あなたの会社は、...
- 質問111 ある会社が新しいワークスペースを作成することを計画しています
- 質問112 モバイルアプリケーションで販売注文を作成するためのストリート
- 質問113 Dynamics 365 for Finance and Operationsシステム管理者です。 ...
- 質問114 モバイルアプリを使用して新しいプロセスを実装する必要がありま
- 質問115 あなたは会社の Dynamics 365 Supply Chain Management を管理し...
- 質問116 ある会社がDynamics365 Financeを実装し、運用開始の準備をして...
- 質問117 注:この質問は、同じシナリオを提示する一連の質問の一部です。
- 質問118 データのインポート、エクスポート、および操作の要件を満たすよ
- 質問119 要件を満たすようにカスタマー サービス担当者の画面を構成する
- 質問120 Dynamics AX 2012からDynamics 365 for Finance and Operations...
- 質問121 LibertyがContosoのビジネスプロセスを使用できることを確認する...
- 質問122 Dynamics 365 for Finance andOperationsの新しいインスタンスを...
- 質問123 企業は、Dynamics 365 for Finance and Operationsと連携するよ...
- 質問124 アカウント担当者向けに顧客の編集プロセスをストリーミングする
- 質問125 あなたはDynamics 365 Financeのシステム管理者です。 注文番号...
- 質問126 Dynamic 365 Supply chain Management を外部システムからのデー...
- 質問127 会社は、Dynamics 365 for Finance and Operationsを実装してい...
- 質問128 企業は Dynamics 365 Commerce を実装しています。会社の電子メ...
- 質問129 連絡先の再割り当ての問題を解決する必要があります。何で検索す
- 質問130 サードパーティのeコマースシステムからDynamics365Financeにイ...
- 質問131 注:この質問は、同じシナリオを提示する一連の質問の一部です。
- 質問132 Dynamics 365 Finance でカスタム機能をサポートします。 あなた...
- 質問133 Dynamics 365 for Finance and Operationsを使用しているシステ...
- 質問134 注:この質問は、同じシナリオを提示する一連の質問の一部です。
- 質問135 あなたの会社は、別の会社を購入した後、何百ものパートナーシッ
- 質問136 会社は Dynamic 365 Supply chain management を使用しています...
- 質問137 社内のユーザーにセキュリティ ロールを割り当てます。 新しい購...
- 質問138 新しいDynamics 365 for Finance and Operations環境で機能コン...
- 質問139 会社は5月1日を会計年度の開始として使用します。 会社の経営陣...
- 質問140 Dynamics 365 Finance にデータをインポートする準備をしていま...
- 質問141 Dynamics 365 for Finance and Operationsシステム管理者です。...
- 質問142 企業は Dynamics 365 Supply Chain Management を使用しています...
- 質問143 あなたはContosoEntertainment System USA(USMF)の機能コンサ...
- 質問144 注:この質問は、同じシナリオを提示する一連の質問の一部です。
- 質問145 注:この質問は、同じシナリオを提示する一連の質問の一部です。
- 質問146 Dynamic 365 Finance を実装しています。 現地のカスタマー サー...
- 質問147 よくある質問 (FAQ) の要件を満たす必要があります。 必要な機能...
- 質問148 消費者向けパッケージ商品を販売する会社は、財務および運用アプ
- 質問149 Dynamites 365 Supply Chain Management を実装しています。Regr...
- 質問150 フォームのパーソナライズの問題を解決する必要があります。 あ
- 質問151 あなたはコンサルタントであり、ローカルおよび多国籍企業の財務
- 質問152 あなたは Dynamics 365 Finance システム管理者です。 ユーザー...
- 質問153 社内のユーザーにセキュリティロールを割り当てます。セキュリテ
- 質問154 ある企業は Dynamics 365 Supply Chain Management を使用してい...
- 質問155 Dynamics 365 for Finance and Operations環境のシステム管理者...
- 質問156 企業は Dynamics 365 Finance と Dynamics 365 Supply Chain Man...
- 質問157 あなたはContosoEntertainment System USA(USMF)の機能コンサ...
- 質問158 会社は、Dynamics 365 for Finance and Operationsを実装してい...
- 質問159 あなたはContosoEntertainment System USA(USMF)の機能コンサ...
- 質問160 あなたはContosoEntertainment System USA(USMF)の機能コンサ...
- 質問161 会社には複雑なセキュリティ要件があります。ユーザーのセキュリ
- 質問162 最小限の特権を持つユーザーは、過去15日間の顧客支払いの入力を...
- 質問163 Dynamics 365 for Finance and Operationsをセットアップします...
- 質問164 あなたは Dynamics 365 Finance を実装しています。 データは、...
- 質問165 ある会社がDynamics365サプライチェーン管理を実装しています。...
- 質問166 生きるために1週間も貧弱な現在のリスクポイントを特定する必要
- 質問167 注:この質問は、同じシナリオを提示する一連の質問の一部です。
