- ホーム
- Microsoft
- DP-900J - Microsoft Azure Data Fundamentals (DP-900日本語版)
- Microsoft.DP-900J.v2024-12-24.q122
- 質問96
有効的なDP-900J問題集はJPNTest.com提供され、DP-900J試験に合格することに役に立ちます!JPNTest.comは今最新DP-900J試験問題集を提供します。JPNTest.com DP-900J試験問題集はもう更新されました。ここでDP-900J問題集のテストエンジンを手に入れます。
DP-900J問題集最新版のアクセス
「313問、30% ディスカウント、特別な割引コード:JPNshiken」
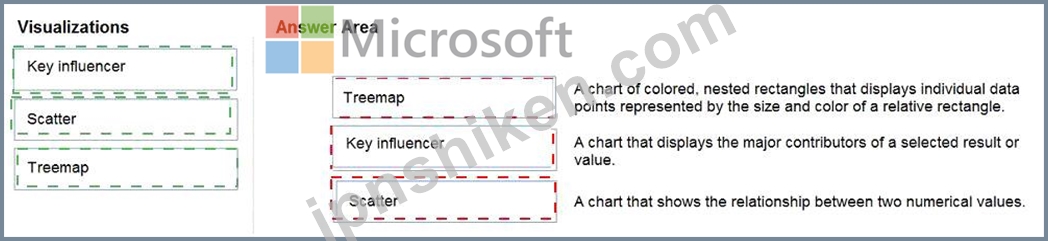
ビジュアライゼーションのタイプを適切な説明に一致させます。
答えるには、適切な視覚化タイプを左側の列から右側の説明にドラッグします。
各視覚化タイプは、1回使用することも、複数回使用することも、まったく使用しないこともできます。
注:正しい一致はそれぞれ1ポイントの価値があります。

答えるには、適切な視覚化タイプを左側の列から右側の説明にドラッグします。
各視覚化タイプは、1回使用することも、複数回使用することも、まったく使用しないこともできます。
注:正しい一致はそれぞれ1ポイントの価値があります。
正解:
Explanation:
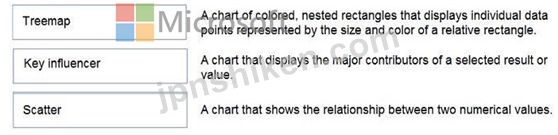
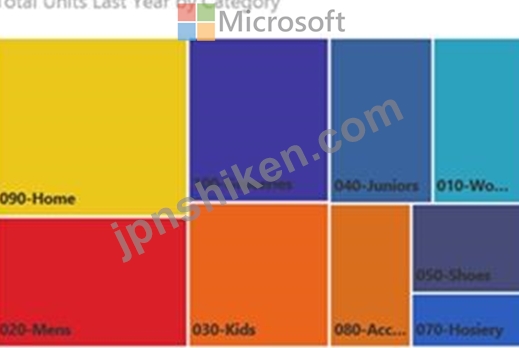
Box 1: Tree map
Treemaps are charts of colored rectangles, with size representing value. They can be hierarchical, with rectangles nested within the main rectangles.
Box 2: Key influencer
A key influencer chart displays the major contributors to a selected result or value.
Box 3: Scatter
Scatter and Bubble charts display relationships between 2 (scatter) or 3 (bubble) quantitative measures -- whether or not, in which order, etc.

- 質問一覧「122問」
- 質問1 あなたの会社は、Webサイトのセッションデータを含むデータベー...
- 質問2 次の各ステートメントについて、ステートメントがtrueの場合は、...
- 質問3 Azure テーブル ストレージでは、テーブルの各行を一意に識別す...
- 質問4 Azure SQLデータベースと比較して、Azure SQLマネージドインスタ...
- 質問5 Azure Blob ストレージでは、BLOB がどのアクセス層間で移動した...
- 質問6 Azureデータファクトリコンポーネントを適切な説明に一致させま...
- 質問7 次の各ステートメントについて、ステートメントがtrueの場合は、...
- 質問8 文を正しく完成させる答えを選択してください。 (Exhibit)...
- 質問9 顧客データと注文データを結合する SQL クエリがあります。クエ...
- 質問10 Web ベースのインターフェイスを使用してデータをクエリおよび視...
- 質問11 文を正しく完成させる答えを選択してください。 (Exhibit)...
- 質問12 データの種類を適切なAzureデータサービスに一致させます。 回答...
- 質問13 次の各ステートメントについて、ステートメントがtrueの場合は、...
- 質問14 どのデータベーストランザクションプロパティが、個々のトランザ
- 質問15 Azureサービスをアーキテクチャ内の適切な場所に一致させます。 ...
- 質問16 次の各ステートメントについて、ステートメントがtrueの場合は、...
- 質問17 次の各ステートメントについて、ステートメントがtrueの場合は、...
- 質問18 文を完成させるには、回答領域で適切なオプションを選択します。
- 質問19 あなたの会社は、抽出ロードおよび変換(ELT)プロセスを使用し...
- 質問20 どのステートメントがデータ操作言語(DML)の例です。
- 質問21 次の各ステートメントについて、ステートメントがtrueの場合は、...
- 質問22 文を完成させるには、回答領域で適切なオプションを選択します。
- 質問23 文を正しく完成させる答えを選択してください。 (Exhibit)...
- 質問24 文を正しく完成させる答えを選択してください。 (Exhibit)...
- 質問25 あるテーブルの行を別のテーブルの行と組み合わせるには、select...
- 質問26 地域ごとの年初来の売上を示す棒グラフは、どのタイプの分析の例
- 質問27 文を正しく完成させる答えを選択してください。 (Exhibit)...
- 質問28 文を正しく完成させる答えを選択してください。次の各ステートメ
- 質問29 ジョブの役割を適切なタスクに対応させます。 回答するには、適
- 質問30 文を完成させるには、回答領域で適切なオプションを選択します。
- 質問31 文を完成させるには、回答領域で適切なオプションを選択します。
- 質問32 文を正しく完成させる答えを選択してください。 (Exhibit)...
- 質問33 文を正しく完成させる答えを選択してください。
- 質問34 顧客データと注文データを組み合わせたSQLクエリがあります a。...
- 質問35 キー/値モデルを実装している Azure Storage サービスはどれです...
- 質問36 各列の名前とデータ型が定義されており、圧縮された列型ストレー
- 質問37 Azure Synapse Analyticsには、毎晩8時間だけアクティブに使用さ...
- 質問38 半構造化され、ログの発生時に受信されるイベントログデータを保
- 質問39 次の各ステートメントについて、ステートメントがtrueの場合は、...
- 質問40 Microsoft Power BIサービスを使用して完全に実行できる2つのア...
- 質問41 データ処理言語を適切なリアルタイム分析サービスに一致させます
- 質問42 次の各ステートメントについて、ステートメントがtrueの場合は、...
- 質問43 文を正しく完成させる答えを選択してください。 (Exhibit)...
- 質問44 次の各ステートメントについて、ステートメントがtrueの場合は、...
- 質問45 文を正しく完成させる答えを選択してください。 (Exhibit)...
- 質問46 Azureサービスを適切な要件に一致させます。 回答するには、適切...
- 質問47 診断分析を実行するときに使用される3つのアクションはどれです
- 質問48 次の各ステートメントについて、ステートメントがtrueの場合は、...
- 質問49 Apache Sparkクラスターのプロビジョニングに使用できる2つのAzu...
- 質問50 次の各ステートメントについて、ステートメントがtrueの場合は、...
- 質問51 文を正しく完成させる答えを選択してください。 (Exhibit)...
- 質問52 グラフ データベースにはどの Azure Cosmos DB API を使用する必...
- 質問53 文を正しく完成させる答えを選択してください。 (Exhibit)...
- 質問54 経営幹部にデータを提供するためのソリューションを開発する必要
- 質問55 次の表を含む在庫管理データベースがあります。 (Exhibit) Produ...
- 質問56 ワークロードのタイプを適切なシナリオに一致させます。 答える
- 質問57 次の各ステートメントについて、ステートメントがtrueの場合は、...
- 質問58 文を正しく完成させる答えを選択してください。 (Exhibit)...
- 質問59 Azureテーブルストレージにデータを格納するには、Azureリソース...
- 質問60 文を正しく完成させる答えを選択してください。 (Exhibit)...
- 質問61 文を完成させるには、回答領域で適切なオプションを選択します。
- 質問62 文を正しく完成させる答えを選択してください。 (Exhibit)...
- 質問63 Sparkクラスターのプロビジョニングに使用できる2つのAzureサー...
- 質問64 文を正しく完成させる答えを選択してください。 (Exhibit)...
- 質問65 次の各ステートメントについて、ステートメントがtrueの場合は、...
- 質問66 次の各ステートメントについて、ステートメントがtrueの場合は、...
- 質問67 文を正しく完成させる答えを選択してください。 (Exhibit)...
- 質問68 AzureStorageアカウントを作成する必要があります。 アカウント...
- 質問69 モバイルアプリケーションからリアルタイムのテレメトリデータを
- 質問70 Windowsで実行され、マップされたドライブへのアクセスを必要と...
- 質問71 文を完成させるには、回答領域で適切なオプションを選択します。
- 質問72 Core(SQL)APIを使用するAzure CosmosDBアカウントがあります。...
- 質問73 文を正しく完成させる答えを選択してください。 (Exhibit)...
- 質問74 分析データ モデルでは、どのタイプのテーブルに数値の集計に使
- 質問75 文を正しく完成させる答えを選択してください。 (Exhibit)...
- 質問76 文を正しく完成させる答えを選択してください。 (Exhibit)...
- 質問77 データベース正規化用語を適切な説明と一致させてください。 回
- 質問78 Azureテーブルストレージを使用してデータを保存する必要があり...
- 質問79 構造化データと半構造化データの違いは何ですか?
- 質問80 文を完成させるには、回答領域で適切なオプションを選択します。
- 質問81 文を正しく完成させる答えを選択してください。 (Exhibit)...
- 質問82 AzureSQLデータベースでProductsという名前のテーブルをクエリす...
- 質問83 文を完成させるには、回答領域で適切なオプションを選択します。
- 質問84 文を正しく完成させる答えを選択してください。 (Exhibit)...
- 質問85 文を正しく完成させる答えを選択してください。 (Exhibit)...
- 質問86 文を正しく完成させる答えを選択してください。 (Exhibit)...
- 質問87 ファイルおよびフォルダーレベルでロールベースのアクセス制御(
- 質問88 Azure Blob StorageからBLOBを自動的に削除するには、何を使用す...
- 質問89 文を正しく完成させる答えを選択してください。 (Exhibit)...
- 質問90 文を完成させるには、回答領域で適切なオプションを選択します。
- 質問91 文を正しく完成させる答えを選択してください。 (Exhibit)...
- 質問92 Spark クラスターのプロビジョニングに使用できる 2 つの Azure ...
- 質問93 データストアのタイプを適切なシナリオに一致させます。 回答す
- 質問94 文を正しく完成させる答えを選択してください。 (Exhibit)...
- 質問95 ビジネスの質問に答えるために使用できる分析のタイプを一致させ
- 質問96 ビジュアライゼーションのタイプを適切な説明に一致させます。
- 質問97 文を完成させるには、回答領域で適切なオプションを選択します。
- 質問98 Azure Synapse Analyticsを使用して、Azure Cosmos DBデータソー...
- 質問99 会社は、Azure仮想マシンがデータベースをインターネットに公開...
- 質問100 Azure SQLデータベースのサーバーレス構成をサポートするAzureリ...
- 質問101 文を正しく完成させる答えを選択してください。 (Exhibit)...
- 質問102 文を完成させるには、回答領域で適切なオプションを選択します。
- 質問103 文を完成させるには、回答領域で適切なオプションを選択します。
- 質問104 文を正しく完成させる答えを選択してください。 (Exhibit)...
- 質問105 Azure SQLデータベースを作成する場合、どのアカウントが常にデ...
- 質問106 Azure Cosmos DBアカウントのスループットを設定できる2つのレベ...
- 質問107 次の各ステートメントについて、ステートメントがtrueの場合は「...
- 質問108 Windowsで実行され、マップされたドライブ全体を必要とするアプ...
- 質問109 文を正しく完成させます。 (Exhibit)
- 質問110 次の各ステートメントについて、ステートメントがtrueの場合は、...
- 質問111 文を完成させるには、回答領域で適切なオプションを選択します。
- 質問112 あなたの会社は、学生のデータを含むデータストアを設計していま
- 質問113 文を正しく完成させる答えを選択してください。 (Exhibit)...
- 質問114 文を完成させるには、回答領域で適切なオプションを選択します。
- 質問115 管理者がAzureSQLデータベースのトラブルシューティングに使用す...
- 質問116 データウェアハウスからデータを読み取る品質保証アプリケーショ
- 質問117 次のデータを含むSalesという名前のテーブルがあります。 (Exhib...
- 質問118 非リレーショナル データの特徴は何ですか?
- 質問119 オンライン トランザクション処理 (OLTP) ワークロードの 3 つの...
- 質問120 次の展示に示すように、四半期ごとの現在の売上合計の視覚化を作
- 質問121 Azure Data LakeStorageの用語を階層内の適切なレベルに一致させ...
- 質問122 次の各ステートメントについて、ステートメントがtrueの場合は、...
