- ホーム
- Microsoft
- DP-100J - Designing and Implementing a Data Science Solution on Azure (DP-100日本語版)
- Microsoft.DP-100J.v2023-11-22.q198
- 質問198
有効的なDP-100J問題集はJPNTest.com提供され、DP-100J試験に合格することに役に立ちます!JPNTest.comは今最新DP-100J試験問題集を提供します。JPNTest.com DP-100J試験問題集はもう更新されました。ここでDP-100J問題集のテストエンジンを手に入れます。
DP-100J問題集最新版のアクセス
「528問、30% ディスカウント、特別な割引コード:JPNshiken」
<<前へ
質問 198/198
さまざまな都市の家の所有権に関する人口統計データを探索する予定です。データは、次の形式のCSVファイルです。
年齢、都市、収入、自宅所有者
21,Chicago,50000,0
35,Seattle,120000,1
23,Seattle,65000,0
45,Seattle,130000,1
18,Chicago,48000,0
データを探索して結果を記録するには、Azure Machine Learningワークスペースで実験を実行する必要があります。実験では、次の情報を記録する必要があります。
*データセット内の観測数
* home_ownerによる収入の箱ひげ図
*都市名と各都市の平均収入を含む辞書必要な情報をログに記録するには、実験の実行オブジェクトの適切なロギングメソッドを使用する必要があります。
どのようにコードを完成させる必要がありますか?回答するには、適切なコードセグメントを正しい場所にドラッグします。各コードセグメントは、1回、複数回、またはまったく使用しない場合があります。コンテンツを表示するには、ペイン間で分割バーをドラッグするか、スクロールする必要がある場合があります。
注:それぞれの正しい選択は1ポイントの価値があります。
正解:
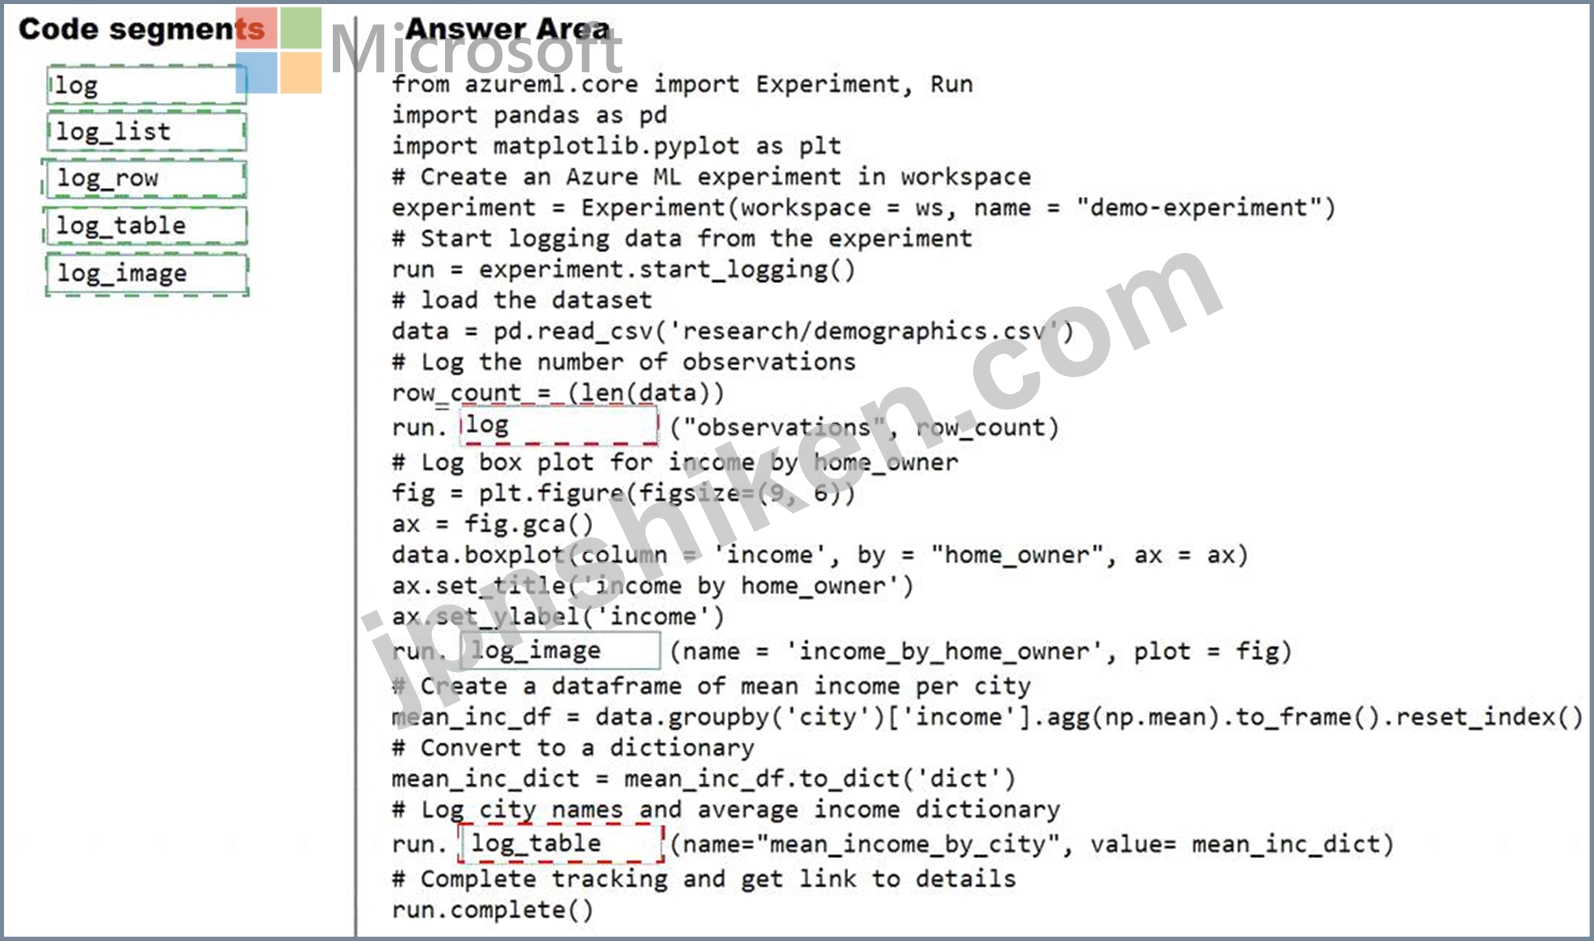
Explanation
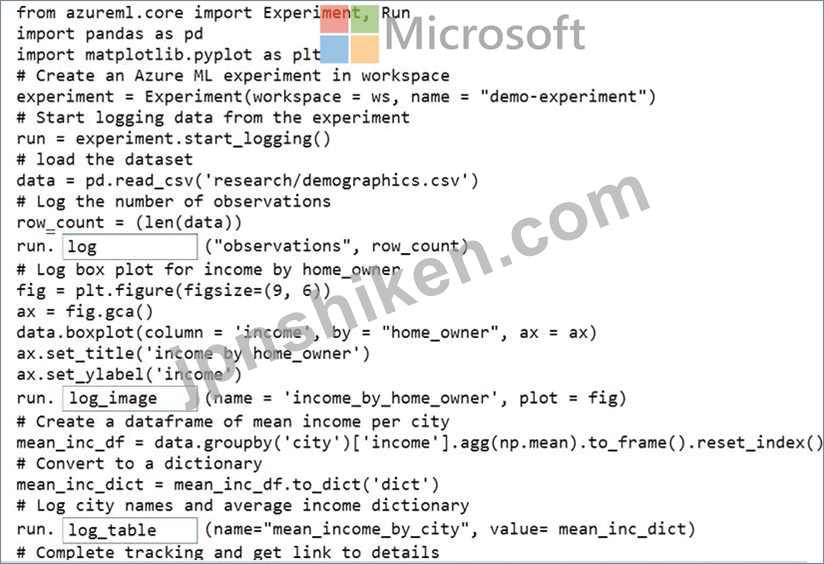
Box 1: log
The number of observations in the dataset.
run.log(name, value, description='')
Scalar values: Log a numerical or string value to the run with the given name. Logging a metric to a run causes that metric to be stored in the run record in the experiment. You can log the same metric multiple times within a run, the result being considered a vector of that metric.
Example: run.log("accuracy", 0.95)
Box 2: log_image
A box plot of income by home_owner.
log_image Log an image to the run record. Use log_image to log a .PNG image file or a matplotlib plot to the run. These images will be visible and comparable in the run record.
Example: run.log_image("ROC", plot=plt)
Box 3: log_table
A dictionary containing the city names and the average income for each city.
log_table: Log a dictionary object to the run with the given name.

- 質問一覧「198問」
- 質問1 Azure Machine Learning ワークスペースには、 という名前のデー...
- 質問2 Azure Machine Learning ワークスペースを作成します。 実験用の...
- 質問3 以前は、CSVファイルのフォルダーに基づくtraining-datasetとい...
- 質問4 モデルの適合の問題を修正する必要があります。 順番に実行する
- 質問5 分類タスクを解いています。 k分割交差検定を使用して、限られた...
- 質問6 Azure Machine Learningサービスを使用するデータサイエンスワー...
- 質問7 トレーニング済みのモデルをAzureMachineLearningワークスペース...
- 質問8 Azure Machine Learning Studioを使用して、バイナリ分類モデル...
- 質問9 Azure Machine Learning を使用してモデルをトラムします。 ハイ...
- 質問10 Pythonで機械学習モデルを作成しています。 提供されたデータセ...
- 質問11 機械学習モデルをトレーニングして登録します。モデルを使用して
- 質問12 Azure Machine Learning Studioで実験を作成します-10.000行を含...
- 質問13 STANDARD_D1 仮想マシン イメージを使用して、名前を付けた Azur...
- 質問14 Azure Machine Learning ワークスペースのノートブックから df ...
- 質問15 あなたは、12,000 件のカスタマー レビューを短文形式で記述した...
- 質問16 (Exhibit) 行数を row_count という名前のメトリクスとして記録...
- 質問17 英語のテキストコンテンツをフランス語のテキストコンテンツに翻
- 質問18 Azure ストレージ アカウント内の BLOB コンテナーを参照する tr...
- 質問19 ハイパードライブを使用して、モデルのトレーニング時に選択され
- 質問20 パブリックエンドポイントからアクセスできるworkspace1という名...
- 質問21 Azure Machine Learningを使用して機械学習モデルをトレーニング...
- 質問22 次のコードを使用して、モデルをAzure Machine Learningリアルタ...
- 質問23 Azure Notebooks で train-classification という名前の Azure M...
- 質問24 モデルのトレーニングに使用されるPythonコードを含むJupyterNot...
- 質問25 Azure Machine Learning スタジオでノートブックを作成していま...
- 質問26 機械学習モデルを作成しています。 データ内の外れ値を識別する
- 質問27 トレーニングと検証のエラー値に大きな差があるモデルがあります
- 質問28 バイナリ分類を実行するリカレントニューラルネットワークを構築
- 質問29 完成したバイナリ分類マシンを評価しています。 評価指標として
- 質問30 Windows用の深層学習仮想マシンを構成します。 以下を実行するに...
- 質問31 Azure Machine Learning ワークスペースを管理するとします。 特...
- 質問32 Azure Machine Learning モデルをトレーニングして登録します モ...
- 質問33 Azure Machine Learning ワークスペースのノートブックからパン...
- 質問34 注:この質問は、同じシナリオを提示する一連の質問の一部です。
- 質問35 Azure MachineLearningワークスペースにいくつかの機械学習モデ...
- 質問36 Azure Machine Learning を使用して、Bandit の早期終了ポリシー...
- 質問37 注:この質問は、同じシナリオを提示する一連の質問の一部です。
- 質問38 モデルのトレーニング要件に従って、順列機能の重要度モジュール
- 質問39 Azure Machine Learning Studioで分類タスクを実行しています。 ...
- 質問40 Azure Machine Learning Designerを使用して、回帰モデルのトレ...
- 質問41 決定木アルゴリズムを使用しています。次のツリー深度で一般化す
- 質問42 財務チームは、finance-dataという名前のAzure Storage BLOBコン...
- 質問43 注:この質問は、同じシナリオを提示する一連の質問の一部です。
- 質問44 バイアスと分散の問題に対処するには、グローバルペナルティイベ
- 質問45 次の Azure サブスクリプションと Azure Machine Learning サー...
- 質問46 ワークスペース1という名前のAzureMachineLearningワークスペー...
- 質問47 Azure Machine Learning ワークスペースを作成します。Azure Mac...
- 質問48 注:この質問は、同じシナリオを提示する一連の質問の一部です。
- 質問49 クリーニングが必要な生のデータセットを分析しています。 Azure...
- 質問50 一連の CSV ファイルには販売レコードが含まれています。すべて...
- 質問51 Azure MachineLearningワークスペースを使用しています。モデル...
- 質問52 機械学習モデルを作成しています。 null行を含むデータセットが...
- 質問53 機械学習モデルが機密機能全体にわたって不公平な予測を生成しま
- 質問54 Azure Machine Learningのハイパードライブ機能を使用してモデル...
- 質問55 注:この質問は、同じシナリオを提示する一連の質問の一部です。
- 質問56 データサイエンスプロジェクト用にAzure Machine Learning Basic...
- 質問57 注:この質問は、同じシナリオを提示する一連の質問の一部です。
- 質問58 Azure Machine Learning ワークスペースを作成します。Azure Mac...
- 質問59 注: この質問は、同じシナリオを提示する一連の質問の一部です。...
- 質問60 Python SDK v2 を使用して、ワークスペース 1 という名前の Azur...
- 質問61 Azure Machine Learning ワークスペースのノートブックから .csv...
- 質問62 Azure Machine Learning StudioからWeka環境に大きなデータセッ...
- 質問63 Azure Machine Learning デザイナーを使用して、トレーニング パ...
- 質問64 統計分布で非対称性を分析しています。 次の画像には、2つのデー...
- 質問65 Gitリポジトリを使用して、Azure MachineLearningワークスペース...
- 質問66 Azure Machine Learning Studioの2クラスニューラルネットワーク...
- 質問67 新しいAzureDatabricksワークスペースを作成します。 次の図に示...
- 質問68 実験の要件とデータセットに基づいて、機能ベースの機能選択モジ
- 質問69 一連のデータサイエンス実験のために、ビルド済みの開発環境を選
- 質問70 AccessibilityToHighway列の欠落データを置き換える必要がありま...
- 質問71 Azure Machine Learning ワークスペースでデータ ラングリングと...
- 質問72 Azure Machine Learningで実験としてスクリプトを実行するには、...
- 質問73 フォルダーを参照する csvjolder という名前のファイル データセ...
- 質問74 Azure MachineLearningワークスペースと新しいAzureDevOps組織を...
- 質問75 TSVファイルのセットを含むAzureBLOBコンテナーがあります。 Azu...
- 質問76 MLflow モデルを作成します バッチ推論のためにモデルを Azure M...
- 質問77 Azure Machine Learning Serviceを使用して、ニューラルネットワ...
- 質問78 Azure Machine Learning SDK for Python を使用して、Azure Mach...
- 質問79 注:この質問は、同じシナリオを提示する一連の質問の一部です。
- 質問80 注:この質問は、同じシナリオを提示する一連の質問の一部です。
- 質問81 Azure Machine Learning デザイナーを使用して、すべての国の国...
- 質問82 近くの気象観測所からデータを収集します。次のデータを含む Wea...
- 質問83 注: この質問は、同じシナリオを示す一連の質問の一部です。この...
- 質問84 Azure Machine Learning スタジオを使用して、column1 という名...
- 質問85 Azure Machine Learning デザイナーを使用してトレーニング パイ...
- 質問86 2 つの異なる年齢グループ内の糖尿病の陽性症例を予測するバイナ...
- 質問87 都市の住宅販売データを含むデータセットがあります。データセッ
- 質問88 分類モデルをトレーニングしたいデータを含むコンマ区切り値(CS...
- 質問89 Azure Machine Learning Studioを使用して機械学習実験を構築し...
- 質問90 Azure Machine Learning ワークスペースを作成します。Azure Mac...
- 質問91 (Exhibit) 次の各ステートメントについて、ステートメントが tru...
- 質問92 注:この質問は、同じシナリオを提示する一連の質問の一部です。
- 質問93 Azure CLI ml 拡張機能 v2 を使用して Azure Machine Learning ...
- 質問94 トレーニングクラスターと推論クラスターを含むAzure Machine Le...
- 質問95 Azure ML SDKを使用して実験を実行する準備をしており、コンピュ...
- 質問96 注:この質問は、同じシナリオを提示する一連の質問の一部です。
- 質問97 テスト要件に従ってデータを分割する方法を特定する必要がありま
- 質問98 コンピューティング クラスターを使用して、新しい Azure Machin...
- 質問99 Azure Machine Learning Python SDK を使用して、バッチ推論パイ...
- 質問100 注:この質問は、同じシナリオを提示する一連の質問の一部です。
- 質問101 チームデータサイエンス環境の構築を計画しています。機械学習パ
- 質問102 Azure Machine Learning ワークスペースを作成します。Azure Mac...
- 質問103 CSVファイルからテキストを前処理する予定です。 Azure Machine ...
- 質問104 Azure Machine Learning SDK for Python を使用して、次のステッ...
- 質問105 Azure Machine Learning ワークスペースで自動機械学習実験を実...
- 質問106 Azure Machine Learning ワークスペースを作成します。Azure Mac...
- 質問107 注:この質問は、同じシナリオを提示する一連の質問の一部です。
- 質問108 特徴抽出方法を選択する必要があります。 どの方法を使用する必
- 質問109 Azure Machine Learning ワークスペースを管理するとします。 ジ...
- 質問110 Azure Machine Learning ワークスペースを作成します。ワークス...
- 質問111 Azure Machine Learning ワークスペースを作成します。 ワークス...
- 質問112 Python SDK v2 を使用して Azure Machine Leaning ソリューショ...
- 質問113 クラウドセンチメントローカルモデルの機能エンジニアリング戦略
- 質問114 パイプラインを実行するPythonスクリプトがあります。スクリプト...
- 質問115 Azure Machine Learning デザイナーを使用して機械学習ソリュー...
- 質問116 次の形式の salesData という名前の Python データ フレームがあ...
- 質問117 深層学習モデルを開発して、半構造化、非構造化、および構造化デ
- 質問118 Azure Machine Learning ワークスペースを作成します。Azure Mac...
- 質問119 パフォーマンスカーブの図に示されているように、広告応答モデル
- 質問120 フィーチャエンジニアリングを行って、さらなる分析のためにデー
- 質問121 Azure Machine Learning ワークスペースがある Azure Machine Le...
- 質問122 ローカルモデルの特徴抽出戦略を構築する必要があります。 どの
- 質問123 Azure Machine Learningデザイナーを使用して実験を構築していま...
- 質問124 Azure Machine Learning Designerを使用して、トレーニングパイ...
- 質問125 株価を予測する機械学習モデルを実装しています。 このモデルは ...
- 質問126 Azure Machine Learning Studio を使用してワークスペースを作成...
- 質問127 グローバルペナルティ検出モデルのサンプリング戦略を構築するに
- 質問128 Azure Machine Learning SDK を使用して、分類モデルをトレーニ...
- 質問129 あなたはホテル予約のウェブサイト会社で働いているデータサイエ
- 質問130 fsi という名前のファイル システムと、folder1 という名前のフ...
- 質問131 Azure Storage BLOBコンテナーに対してml-dataという名前のデー...
- 質問132 Azure Machine Learningワークスペースから実行される実験を取得...
- 質問133 銀行会社がクレジットカード詐欺の可能性のあるインスタンスを識
- 質問134 Azure Machine Learningのハイパードライブ機能を使用して、モデ...
- 質問135 Azure Machine Learningを使用して、dataset1という名前のデータ...
- 質問136 TensorFlowを使用してディープラーニングモデルを開発しています...
- 質問137 あなたは、測定値からペンギンの種類を予測できる機械学習モデル
- 質問138 Azure Machine Learning ワークスペースに格納されているデータ...
- 質問139 AzureのWindowsおよびLinux用のData Science Virtual Machines(...
- 質問140 Python SDK v2 を使用して、workspace1 という名前の Azure Mach...
- 質問141 Azure Machine Learning ワークスペースを作成し、tram.py とい...
- 質問142 workspace1 という名前の Azure Machine learning ワークスペー...
- 質問143 群衆感情モデルの評価戦略を定義する必要があります。 順番に実
- 質問144 Azure Machine Learning Studioを使用して、機械学習実験を構築...
- 質問145 注: この質問は、同じシナリオを提示する一連の質問の一部です。...
- 質問146 Azure Machine Learning ワークスペースを管理するとします。Azu...
- 質問147 ML-workspaceという名前のAzureMachineLearningワークスペースを...
- 質問148 注:この質問は、同じシナリオを提示する一連の質問の一部です。
- 質問149 あなたは、鳥の健康と渡りを追跡するプロジェクトの主任データ
- 質問150 Azure Machine Learning ワークスペースを管理します。Azure Mac...
- 質問151 Azure MachineLearningワークスペースを使用します。 次のPython...
- 質問152 注: この質問は、同じシナリオを示す一連の質問の一部です。この...
- 質問153 あなたは鳥の健康と移動を追跡するプロジェクトのリードデータサ
- 質問154 Azure Machine Learning を使用して機械学習モデルをトレーニン...
- 質問155 参加者にDocker for Windowsを紹介するための実践的なワークショ...
- 質問156 Azure Machine Learning トレーニング実験を実行します。トレー...
- 質問157 Azure Machine Learning モデルを作成して、モデル ファイルと軽...
- 質問158 広告応答のモデリング戦略を定義する必要があります。 順番に実
- 質問159 次の Azure サブスクリプションと Azure Machine Learning サー...
- 質問160 複数のエポックにわたって畳み込みニューラル ネットワーク モデ...
- 質問161 モデルのトレーニング時に、Azure Machine Learning のハイパー...
- 質問162 二項分類モデルを作成します。モデルはAzureMachineLearningワー...
- 質問163 音声認識の深層学習モデルを作成する予定です。 モデルはPython...
- 質問164 workspace1 という名前の Azure Machine Learning ワークスペー...
- 質問165 決定木アルゴリズムを使用して分類モデルをトレーニングします。
- 質問166 注:この質問は、同じシナリオを提示する一連の質問の一部です。
- 質問167 Python スクリプトを含む 2 つのステップで、pipeline1 という名...
- 質問168 Azure Machine Learningで機械学習モデルをトレーニングします。...
- 質問169 GPUベースのトレーニングを使用して、Azure Machine Learningサ...
- 質問170 Azure Machine Learning デザイナーでトレーニング パイプライン...
- 質問171 注:この質問は、同じシナリオを提示する一連の質問の一部です。
- 質問172 注:この質問は、同じシナリオを提示する一連の質問の一部です。
- 質問173 ローカル ワークステーションで Azure Machine Learning Python ...
- 質問174 ノートブックからモデル トレーニングのハイパーパラメーター調
- 質問175 Azure Machine Learning ワークスペースがあります。ディープ ラ...
- 質問176 Azure MachineLearningのリモートコンピューティングでトレーニ...
- 質問177 機密データを含むデータセットがあります a。データセットを使用...
- 質問178 Azure Machine Learning Studio を使用してワークスペースを作成...
- 質問179 一連のラベル付き写真を使用するマルチクラス画像分類の深層学習
- 質問180 Azure Machine Learning Designerを使用して、トレーニングパイ...
- 質問181 注:この質問は、同じシナリオを提示する一連の質問の一部です。
- 質問182 あなたのチームは、データエンジニアリングおよびデータサイエン
- 質問183 Azure Machine Learning ワークスペースがあります。ローカル コ...
- 質問184 Azure Machine Learning SDK for Python を使用して、2 段階のパ...
- 質問185 Azure Machine Learning を使用してモデルをトレーニングします...
- 質問186 Azure Machine Learning Studioを使用してデータセットを分析し...
- 質問187 Azure Machine Learning を使用してハイパー パラメーター チュ...
- 質問188 Azure Machine Learningを使用して、モデルをトレーニングおよび...
- 質問189 Azure Machine Learning ワークスペースを管理するとします。Azu...
- 質問190 注:この質問は、同じシナリオを提示する一連の質問の一部です。
- 質問191 自動車価格データを含む Azure Machine Learning データセットを...
- 質問192 Azure Machine Learning Studioを使用して、2つのデータセットが...
- 質問193 Azure Machine Learning ワークスペースを管理するとします。既...
- 質問194 注:この質問は、同じシナリオを提示する一連の質問の一部です。
- 質問195 Azure MachineLearningワークスペースを使用します。 Webサービ...
- 質問196 同僚が次のコードを使用して、機械学習サービスワークスペースに
- 質問197 マルチクラス画像分類深層学習モデルを作成します。 モデルは、
- 質問198 さまざまな都市の家の所有権に関する人口統計データを探索する予
