The analytics feature enables you to show percentiles across groups specified along a specific axis.
Example:
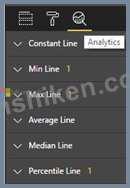
1. Click on the analytics tab
2. Select Percentile
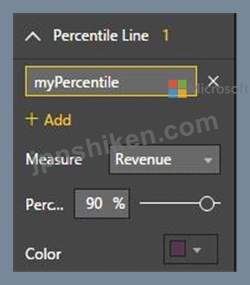
3. You can choose a specific percentile along with other formatting options.
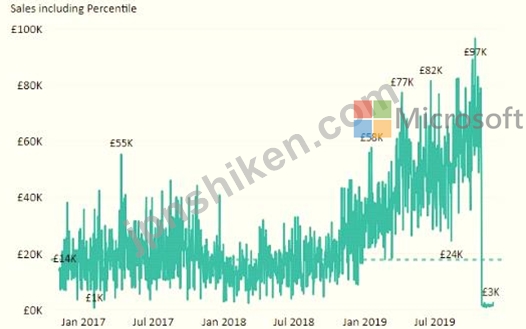
4. Drag a date or non-numeric dimension into the Axis of a column chart
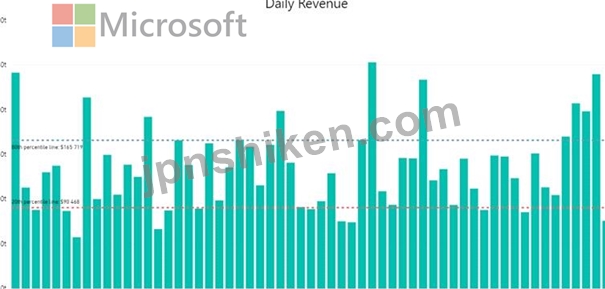
Add percentile lines to monitor daily revenue