- ホーム
- Microsoft
- AZ-400J - Designing and Implementing Microsoft DevOps Solutions (AZ-400日本語版)
- Microsoft.AZ-400J.v2026-09-05.q304
- 質問197
有効的なAZ-400J問題集はJPNTest.com提供され、AZ-400J試験に合格することに役に立ちます!JPNTest.comは今最新AZ-400J試験問題集を提供します。JPNTest.com AZ-400J試験問題集はもう更新されました。ここでAZ-400J問題集のテストエンジンを手に入れます。
AZ-400J問題集最新版のアクセス
「628問、30% ディスカウント、特別な割引コード:JPNshiken」
ホットスポットに関する質問
Azure DevOps に、App1 という名前のアプリを開発するために使用されるプロジェクトがあります。
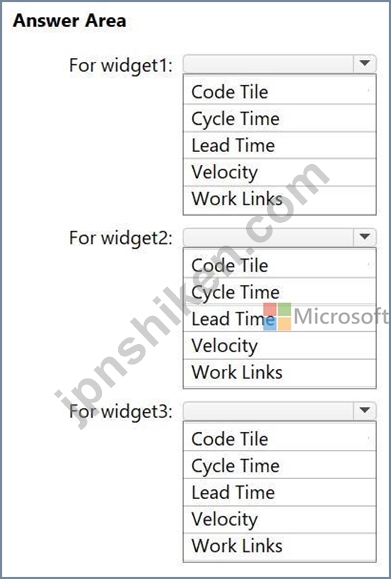
プロジェクトのバックログを視覚化するために、App1 のダッシュボードを作成する必要があります。ダッシュボードには以下のウィジェットを含める必要があります。
- ウィジェット1: チームのキャパシティ能力を特定し、
各チームが完了できる作業。
- ウィジェット2: チームが作業項目を完了するのにかかる時間を表示する
チームが作業を開始するとすぐに。
- ウィジェット3: メインブランチ内の最近の変更の数を表示する
リポジトリの。
各ウィジェットにはどのタイプのウィジェットを使用する必要がありますか? 回答するには、回答領域で適切なオプションを選択してください。
注意: 正しい選択ごとに 1 ポイントが加算されます。
Azure DevOps に、App1 という名前のアプリを開発するために使用されるプロジェクトがあります。
プロジェクトのバックログを視覚化するために、App1 のダッシュボードを作成する必要があります。ダッシュボードには以下のウィジェットを含める必要があります。
- ウィジェット1: チームのキャパシティ能力を特定し、
各チームが完了できる作業。
- ウィジェット2: チームが作業項目を完了するのにかかる時間を表示する
チームが作業を開始するとすぐに。
- ウィジェット3: メインブランチ内の最近の変更の数を表示する
リポジトリの。
各ウィジェットにはどのタイプのウィジェットを使用する必要がありますか? 回答するには、回答領域で適切なオプションを選択してください。
注意: 正しい選択ごとに 1 ポイントが加算されます。
正解:
Explanation:
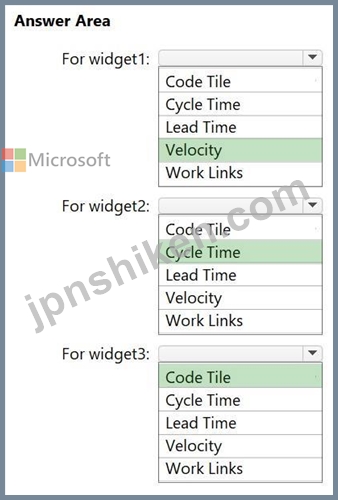
Box 1: Velocity
Widget1: Identify team capacity capabilities and show the amount of work each team can complete.
The Velocity widget is designed specifically to track a team's capacity and progress sprint after sprint. It helps visualize the amount of work a team can complete by displaying the total planned work versus completed work over a series of iterations. Scrum masters and project managers can use this information to estimate future capacity and forecast the product backlog effectively.
Box 2: Cycle Time
Widget2: Display how long it takes for a team to complete work items once the team begins working on them.
Cycle Time measures the time it takes to complete work items once active work has commenced, which is a different metric than a team's overall capacity and ability to complete future work.
Box 3: Code Tile
Widget3: Display the number of recent changes within the main branch of a repository.
In Azure DevOps, you can use the Code Tile widget to visualize repository activity directly on your dashboard.
Key Features
Activity at a Glance: The tile provides a quick numerical view of activity, which is more detailed than the standard repository overview.
Direct Drill-down: Clicking the tile takes you directly to the commit history for that branch to review specific changes.
Reference:
https://learn.microsoft.com/en-us/azure/devops/report/dashboards/widget-catalog?view=azure- devops
https://learn.microsoft.com/en-us/azure/devops/report/dashboards/overview?view=azure-devops

- 質問一覧「304問」
- 質問1 Azure Pipelines に、時々失敗するビルド パイプラインがありま...
- 質問2 シミュレーション デフォルトのメイン ブランチがまだ存在しない...
- 質問3 ホットスポットに関する質問 Azure DevOps には、Azure Pipeline...
- 質問4 あなたの会社にはAzure DevOpsプロジェクトがあり、 プロジェク...
- 質問5 注: この質問は、同一の設定を示す複数の質問に含まれています。...
- 質問6 ケーススタディ3 - ウッドグローブ銀行 概要 概要 Woodgrove Ban...
- 質問7 ソースコードリポジトリとしてGitHubを使用しています。 commit-...
- 質問8 正確かどうかを確認するには、下線部のセグメントを考慮する必要
- 質問9 セマンティック バージョニング (SemVer) を使用するコンテナー ...
- 質問10 Azure DevOps に Project1 というプロジェクトがあります。Proje...
- 質問11 ホットスポットに関する質問 Webapp1 という名前の Azure Web ア...
- 質問12 注: この質問は、同じシナリオを提示する一連の質問の一部です。...
- 質問13 Windows Server を実行する Azure 仮想マシンのベースライン メ...
- 質問14 ホットスポットに関する質問 あなたの会社では、3 つのモバイル ...
- 質問15 あなたの会社はソース管理にGitHubを使用しています。同社には、...
- 質問16 App1 という名前のアプリを含む Azure サブスクリプションがあり...
- 質問17 あなたの会社はAzure DevOpsに新しいWebアプリケーションのプロ...
- 質問18 ケーススタディ3 - ウッドグローブ銀行 概要 概要 Woodgrove Ban...
- 質問19 App1 という名前の Azure App Service アプリがあります。 App1...
- 質問20 ホットスポットに関する質問 Azure DevOps を使用して、App1 と...
- 質問21 ドラッグアンドドロップの質問 Azure DevOps にプロジェクトがあ...
- 質問22 シミュレーション D:\Deploy.json という名前のテンプレートを D...
- 質問23 ドラッグアンドドロップの質問 User1、User2、User3 という3人の...
- 質問24 ケーススタディ2 - Contoso社 背景 Contoso 社はシカゴに本社を...
- 質問25 ドラッグアンドドロップの質問 Repo1 という名前の GitHub リポ...
- 質問26 .NET Coreアプリケーションを含むイメージを作成する予定です。 ...
- 質問27 ドラッグアンドドロップの質問 repo1 という名前の Azure Repos ...
- 質問28 あなたの会社では以下のリソースを使用しています: - Azure コン...
- 質問29 シミュレーション Project1 では、次の変数を含む varGroup1 と...
- 質問30 Azure DevOps で、Azure Boards ボードを使用し、GitHub リポジ...
- 質問31 ソース コードを管理するには Azure Repos を使用し、継続的イン...
- 質問32 注: この質問は、同じシナリオを示す一連の質問の一部です。この...
- 質問33 ホットスポットに関する質問 Repo1 という名前の GitHub リポジ...
- 質問34 ドラッグアンドドロップの質問 Windows Server 2019 を実行する ...
- 質問35 repo1 という名前の GitHub リポジトリがあります。 repo1 に変...
- 質問36 次の表に示すリソースを含む Azure サブスクリプションがありま...
- 質問37 注: この質問は、同一の設定を示す複数の質問に含まれています。...
- 質問38 プロジェクトの管理には Azure Boards を使用します。プロジェク...
- 質問39 注: この質問は、同じシナリオを提示する一連の質問の一部です。...
- 質問40 ケーススタディ3 - ウッドグローブ銀行 概要 概要 Woodgrove Ban...
- 質問41 Azure Board を使用してプロジェクトを管理し、Azure Repos を使...
- 質問42 注:この質問は同じシナリオを提示する一連の質問の一部です。連
- 質問43 ドラッグアンドドロップの質問 Azure Artifacts を使用して、Nod...
- 質問44 注: この質問は、同一の設定を示す複数の質問に含まれています。...
- 質問45 Azure Web Apps フロント エンドと Azure SQL Database バックエ...
- 質問46 ホットスポットに関する質問 Azure Pipelines を使用して複数の...
- 質問47 あなたは多層アプリケーションを開発しています。アプリケーショ
- 質問48 ホットスポットに関する質問 ビルド パイプラインを含む Azure D...
- 質問49 Azure Pipelines を使用して、Production-A と Production-B と...
- 質問50 Azure DevOps に Project1 という名前のプロジェクトがあり、こ...
- 質問51 ある企業は現在、Azure 仮想マシン上に Jenkins を導入する計画...
- 質問52 Azure Board を使用してプロジェクトを管理し、Azure Repos を使...
- 質問53 プロビジョニングされたデバイスとプロビジョニングされていない
- 質問54 Azure Pipelines パイプラインを使用して、App1 という名前のア...
- 質問55 ホットスポットに関する質問 GitHub Enterprise アカウントをお...
- 質問56 ケーススタディ2 - Contoso社 背景 Contoso 社はシカゴに本社を...
- 質問57 ドラッグアンドドロップの質問 次の表に示すリポジトリがありま
- 質問58 App1 という名前の Web アプリがあります。 次の要件を満たす Ap...
- 質問59 GitHub を使用してコードを管理します。 リポジトリ内で新しい脆...
- 質問60 シミュレーション Project1 のデフォルトのプロジェクト チーム...
- 質問61 ホットスポットに関する質問 Azure DevOps に、User1 と User2 ...
- 質問62 複数のワークフローと環境レベルで保存されたシークレットを含む
- 質問63 ケーススタディ3 - ウッドグローブ銀行 概要 概要 Woodgrove Ban...
- 質問64 Azure Boards と統合された GitHub リポジトリがあります。Azure...
- 質問65 ホットスポットに関する質問 Linux を実行する VM1 という名前の...
- 質問66 あなたの会社には、約 50 個のオープン ソース ライブラリを活用...
- 質問67 ホットスポットに関する質問 Azure Kubernetes Service (AKS) ポ...
- 質問68 ビルドパイプラインを含むAzure DevOpsプロジェクトがあります。...
- 質問69 ドラッグアンドドロップの質問 repo1 という名前の GitHub リポ...
- 質問70 注: この質問は、同じシナリオを提示する一連の質問の一部です。...
- 質問71 ドラッグアンドドロップの質問 Exabeam Fusion SIEM と Azure ク...
- 質問72 あなたの会社には4つのチームに割り当てられた60人の開発者がい...
- 質問73 注:この質問は、同じシナリオを提示する一連の質問の一部です。
- 質問74 次の表に示すリソースを含む Azure サブスクリプションがありま...
- 質問75 注:この質問は、同じシナリオを提示する一連の質問の一部です。
- 質問76 Azure Boards を使用してプロジェクトを管理します。 現在、item...
- 質問77 App1 という名前のアプリをデプロイするために使用される Azure ...
- 質問78 会社で新しい Azure DevOps チームを作成します。 スプリント計...
- 質問79 Azure Pipelines を使用して、アプリケーション コードをビルド...
- 質問80 AzurePipelinesとGitHubがソースコードリポジトリとして統合され...
- 質問81 Pipeline1 という名前の Azure Pipelines パイプラインと、App1 ...
- 質問82 ホットスポットに関する質問 あなたの会社では Git ソースコード...
- 質問83 storage1 という名前のストレージ アカウントを含む Azure サブ...
- 質問84 Azure Boards を使用してプロジェクトを管理し、Azure Repos を...
- 質問85 注: この質問は、同じシナリオを提示する一連の質問の一部です。...
- 質問86 50 台の仮想マシンを含む Azure サブスクリプションがあります。...
- 質問87 ホットスポットに関する質問 Azure DevOps に、GitHub リポジト...
- 質問88 シミュレーション az400-9940427-func1 という App Service プラ...
- 質問89 Azure AppServiceでホストされているWebアプリがあります。 Web...
- 質問90 構成ファイルに格納されている資格情報を使用して Azure リソー...
- 質問91 チームの開発プロセスのセキュリティを強化する任務を負っていま
- 質問92 あなたの会社は、AndroidデバイスとOSデバイスをターゲットにし...
- 質問93 ドラッグアンドドロップの質問 ソースコード リポジトリとして G...
- 質問94 Azure ApplicationInsightsとWebアプリの共有サービスプラン層を...
- 質問95 ドラッグアンドドロップの質問 開発プロセスで Azure DevOps を...
- 質問96 Azure サブスクリプションをお持ちです。 仮想マシンと Web サイ...
- 質問97 ホットスポットに関する質問 Windows Server を実行する仮想マシ...
- 質問98 ASP.NET Core アプリケーションを構築しています。 テレメトリ ...
- 質問99 ドラッグアンドドロップの質問 key1 という名前の暗号化キーを含...
- 質問100 .NET Coreアプリケーションを含むイメージを作成する予定です。 ...
- 質問101 ある企業は、Node.js アプリケーション用のパッケージ管理ソリュ...
- 質問102 ホットスポットに関する質問 Azure DevOps を使用してビルド パ...
- 質問103 会社の開発プロセスを設計しています。 問題があることがわかっ
- 質問104 コードレビュー中に、多くの品質上の問題が見つかりました。多く
- 質問105 注:この質問は同じシナリオを提示する一連の質問の一部です。
- 質問106 あなたの会社は新しいアプリケーションのためにAzure DevOpsにプ...
- 質問107 会社のテストプロセスを自動化しています。 Web アプリケーショ...
- 質問108 Azure DevOps で作成する予定です。複数の開発者がプロジェ...
- 質問109 ドラッグアンドドロップの質問 あなたの会社には、Azure DevOps ...
- 質問110 現在、APP-01 という名前のアプリのリリース戦略を定義していま...
- 質問111 ホットスポットに関する質問 現在、DevOps プロセスの一環として...
- 質問112 注:この質問は、同じシナリオを提示する一連の質問の一部です。
- 質問113 ドラッグアンドドロップの質問 Azure Monitor で Application In...
- 質問114 ホットスポットに関する質問 あなたの会社では、ソース管理にGit...
- 質問115 注:この質問は、同じシナリオを提示する一連の質問の一部です。
- 質問116 ドラッグアンドドロップの質問 アプリケーション ビルド プロセ...
- 質問117 Azure DevOps に Project1 というプロジェクトがあります。Proje...
- 質問118 Azure Container Apps を使用してデプロイされる App1 という名...
- 質問119 注: この質問は、同じシナリオを提示する一連の質問の一部です。...
- 質問120 シミュレーション 2 つの Azure リージョンでホストされる Web ...
- 質問121 注: この質問は、同じシナリオを提示する一連の質問の一部です。...
- 質問122 ホットスポットに関する質問 App1 という名前のアプリをビルドお...
- 質問123 ドラッグアンドドロップの質問 次の表に示すように、Azure DevOp...
- 質問124 ドラッグアンドドロップの質問 Azure DevOps にプロジェクトがあ...
- 質問125 シミュレーション デフォルトのメイン ブランチがまだ存在しない...
- 質問126 ドラッグアンドドロップの質問 Azure Kubernetes Service (AKS) ...
- 質問127 あなたの会社はDocketコンテナにアプリケーションを展開します。...
- 質問128 ドラッグアンドドロップの質問 Azure DevOps デプロイ パイプラ...
- 質問129 プロジェクトチームは、パイプラインを使用したプロジェクトの構
- 質問130 注: この質問は、同じシナリオを提示する一連の質問の一部です。...
- 質問131 ホットスポットに関する質問 次の定義を持つ Azure Pipelines パ...
- 質問132 あるチームは現在、Azure Devops のプロジェクトを使用していま...
- 質問133 ホットスポットに関する質問 Azure サブスクリプションをお持ち...
- 質問134 プロジェクトの管理にはAzure Boardsを使用します。プロジェクト...
- 質問135 Azure Pipelines を使用してコードをビルドおよびテストします。...
- 質問136 セルフホスト型 Linux エージェントをプロビジョニングする予定...
- 質問137 認証に Azure Active Directory (Azure AD) を使用するように Gi...
- 質問138 ドラッグアンドドロップの質問 Azure DevOps の Project1 という...
- 質問139 Pipeline1 という名前の Azure DevOps パイプラインがあります。...
- 質問140 ホットスポットに関する質問 4 つの Azure サブスクリプションを...
- 質問141 ドラッグアンドドロップの質問 ソース管理には Git を使用します...
- 質問142 注: この質問は、同じシナリオを提示する一連の質問の一部です。...
- 質問143 プロビジョニングされたデバイスとプロビジョニングされていない
- 質問144 あるチームは、複数のサーバーにAzure Automation DSCを実装した...
- 質問145 ソース管理には Git を使用します。 GitHub コードスキャンを有...
- 質問146 AzurePipelinesとMicrosoftTeamsを統合しています。 AzurePipeli...
- 質問147 ドラッグアンドドロップの質問 チームの開発プロセスのセキュリ
- 質問148 あなたの会社はソフトウェア開発にアジャイルなアプローチを使う
- 質問149 コードとしてのインフラストラクチャ (IaC) リソースを含む Repo...
- 質問150 貴社では、Javaベースのプロジェクトのビルドパイプラインとデプ...
- 質問151 GitHubリポジトリを使用するオープンソースソリューションを開発...
- 質問152 シミュレーション RG1lod12345678 リソース グループの場合、ア...
- 質問153 シミュレーション あなたの会社では、すべての Azure Web アプリ...
- 質問154 ホットスポットに関する質問 Desired State Configuration (DSC)...
- 質問155 注:この質問は、同じシナリオを提示する一連の質問の一部です。
- 質問156 ドラッグアンドドロップの質問 Repo1 という名前のリポジトリを...
- 質問157 ホットスポットに関する質問 Vault1 という名前の Azure キー コ...
- 質問158 シミュレーション az400-9940427-main という名前の Azure Appli...
- 質問159 あるチームは現在、GitHub にソースコードリポジトリを定義して...
- 質問160 Azure Boards を使用してプロジェクトを管理し、GitHub リポジト...
- 質問161 あなたの会社には、ノード パッケージ マネージャー (npm) パッ...
- 質問162 ドラッグアンドドロップの質問 Pipeline1 という名前の Azure Pi...
- 質問163 シミュレーション Project1 では、Mermaid 構文を使用して図をレ...
- 質問164 ソース管理には GitHub を使用します。 プロキシを使用して、プ...
- 質問165 シミュレーション az40010480345acr1 という名前のリポジトリが ...
- 質問166 Azure DevOps に Project1 という名前のプロジェクトがあります...
- 質問167 Contoso という名前の Azure DevOps 組織と Project1 という名前...
- 質問168 あなたの会社はアジャイル開発方法論を実装しています。 各スプ
- 質問169 シミュレーション VM1 という名前の仮想マシンのブート診断を保...
- 質問170 注: このセクションには、同じシナリオと問題を扱う1つ以上の質...
- 質問171 注:この質問は、同じシナリオを提示する一連の質問の一部です。
- 質問172 ホットスポットに関する質問 Azure サブスクリプションをお持ち...
- 質問173 20 台の仮想マシンを含む Azure サブスクリプションがあります。...
- 質問174 GitHub を使用してソース コードの管理とバージョン管理を行いま...
- 質問175 ホットスポットに関する質問 次の図に示すような Azure DevOps ...
- 質問176 ケーススタディ1 - Litware 概要 既存の環境 Litware, Inc.は独...
- 質問177 ホットスポットに関する質問 アプリのビルドとデプロイを管理す
- 質問178 注: この質問は、同じシナリオを提示する一連の質問の一部です。...
- 質問179 注:この質問は、同じシナリオを提示する一連の質問の一部です。
- 質問180 ドラッグアンドドロップの質問 次のアセットを持つアプリケーシ
- 質問181 Contoso という名前の Azure DevOps 組織があります。 次の要件...
- 質問182 Contoso という名前の Azure DevOps 組織と Azure サブスクリプ...
- 質問183 Azure Pipelines には、さまざまなジョブを使用して 10 種類の異...
- 質問184 ホットスポットに関する質問 GitHub を使用して、App1 という名...
- 質問185 ドラッグアンドドロップの質問 Terraform 経由で Azure リソース...
- 質問186 ホットスポットに関する質問 App1 という名前のアプリを構築する...
- 質問187 多層アプリケーションを展開するAzure Resource Managerテンプレ...
- 質問188 多層アプリケーションがあります。アプリケーションのフロント
- 質問189 会社では、Azure Repos の Git リポジトリを使用して Web アプリ...
- 質問190 あるチームは現在、JavaベースのプロジェクトにAzure Devopsを使...
- 質問191 ホットスポットに関する質問 コンテナーを使用してビルドおよび
- 質問192 ホットスポットに関する質問 あなたの会社では、App1 という複雑...
- 質問193 注: このセクションには、同じシナリオと問題を扱う1つ以上の質...
- 質問194 ホットスポットに関する質問 Azure DevOps ビルド パイプライン...
- 質問195 正確かどうかを確認するには、下線部のセグメントを考慮する必要
- 質問196 ドラッグアンドドロップの質問 50 台の仮想マシンを含む Azure ...
- 質問197 ホットスポットに関する質問 Azure DevOps に、App1 という名前...
- 質問198 注:この質問は、同じシナリオを提示する一連の質問の一部です。
- 質問199 注:この質問は、同じシナリオを提示する一連の質問の一部です。
- 質問200 ホットスポットに関する質問 Main.bicep という名前の Bicep フ...
- 質問201 Azure DevOps プロセスを使用して、コードをビルドおよびデプロ...
- 質問202 ホットスポットに関する質問 Azure DevOps には、Teams 展示に示...
- 質問203 ドラッグアンドドロップの質問 あなたの会社では、Azure Applica...
- 質問204 ホットスポットに関する質問 次の表に示すアプリ用に、YAML ベー...
- 質問205 Azure Pipelines を使用してリリースする App1 という名前のアプ...
- 質問206 あなたの会社はソフトウェア開発にアジャイルアプローチを使うこ
- 質問207 ドラッグアンドドロップの質問 オンプレミスのBitbucket Server...
- 質問208 ドラッグアンドドロップの質問 次の要件を持つ新しいプロジェク
- 質問209 ケーススタディ2 - Contoso社 背景 Contoso 社はシカゴに本社を...
- 質問210 ドラッグアンドドロップの質問 App1 という名前のアプリのソース...
- 質問211 AzureDevOpsにProject1という名前のプロジェクトがあります。 Pr...
- 質問212 ケーススタディ2 - Contoso社 背景 Contoso 社はシカゴに本社を...
- 質問213 あなたの会社では、パッケージ管理に Azure Artifacts を使用し...
- 質問214 ホットスポットに関する質問 web1 という名前の Azure 仮想マシ...
- 質問215 ソース管理リポジトリにはGitHub Enterpriseを使用します。リポ...
- 質問216 監視には、Azure SQL Database Intelligent Insights と Azure A...
- 質問217 あなたの会社はOS用のアプリを開発しています。アプリのすべての...
- 質問218 ケーススタディ1 - Litware 概要 既存の環境 Litware, Inc.は独...
- 質問219 ビルドパイプラインを含むAzure DevOpsプロジェクトがあります。...
- 質問220 注:この質問は、同じシナリオを提示する一連の質問の一部です。
- 質問221 注: この質問は、同じシナリオを提示する一連の質問の一部です。...
- 質問222 注: この質問は、同じシナリオを提示する一連の質問の一部です。...
- 質問223 GitHub リポジトリがあります。 メイン ブランチを展開する前に...
- 質問224 ホットスポットに関する質問 Azure DevOps プロジェクトがありま...
- 質問225 あなたの会社は、開発者がオープンソースライブラリを導入すると
- 質問226 ホットスポットに関する質問 次の定義を持つ Azure Pipelines パ...
- 質問227 あなたの会社では、ビルドにクラウドホスト型の Jenkins を使用...
- 質問228 パッケージ フィードは、Azure Artifacts を使用して管理します...
- 質問229 ドラッグアンドドロップの質問 Azure Repos に Repo1 という名前...
- 質問230 注: この質問は、同じシナリオを提示する一連の質問の一部です。...
- 質問231 ドラッグアンドドロップの質問 RG1 という名前のリソース グルー...
- 質問232 あなたの会社はインシデント管理にService Nowを使っています。 ...
- 質問233 ホットスポットに関する質問 .NET Core ランタイム スタックを使...
- 質問234 注:この質問は、同じシナリオを提示する一連の質問の一部です。
- 質問235 ホットスポットに関する質問 Azure Pipelines パイプラインを使...
- 質問236 ソース管理とプロジェクト関連のディスカッションにはGitHubを使...
- 質問237 ドラッグアンドドロップの質問 ソース管理に使用される Repo1 と...
- 質問238 ドラッグアンドドロップの質問 Azure DevOps にプロジェクトがあ...
- 質問239 次の式を含む Azure Resource Manager (ARM) テンプレートがあり...
- 質問240 Azure DevOps に既存のプロジェクトがあります。 プロジェクトの...
- 質問241 シミュレーション DevTest Labs環境でaz400-という名前の仮想マ...
- 質問242 WhiteSource Boltを使用してNode.jsアプリケーションをスキャン...
- 質問243 Public1 という名前のパブリック GitHub リポジトリがあります。...
- 質問244 ドラッグアンドドロップの質問 Azure サブスクリプションをお持...
- 質問245 Project1という名前のAzure DevOpsプロジェクトと、Sub1という名...
- 質問246 ホットスポットに関する質問 Azure DevOps に継続的インテグレー...
- 質問247 正確かどうかを確認するには、下線部のセグメントを考慮する必要
- 質問248 ビルドパイプラインを含むAzure DevOpsプロジェクトがあります。...
- 質問249 ドラッグアンドドロップの質問 Azure パイプラインがあります。 ...
- 質問250 注:この質問は、同じシナリオを提示する一連の質問の一部です。
- 質問251 ケーススタディ3 - ウッドグローブ銀行 概要 概要 Woodgrove Ban...
- 質問252 Azure DevOpsのプロジェクトにブランドポリシーがあります。ポリ...
- 質問253 ドラッグアンドドロップの質問 RBAC 対応クラスターで、Helm と ...
- 質問254 ケーススタディ1 - Litware 概要 既存の環境 Litware, Inc.は独...
- 質問255 Azure DevOps のダッシュボードのプロジェクト メトリックを構成...
- 質問256 Azure DevOps に、App1 というアプリの開発に使用する App Proje...
- 質問257 あなたの会社では、本番環境に導入される App1 という名前のアプ...
- 質問258 プライベート GitHub リポジトリがあります。 Azure Boards でリ...
- 質問259 ホットスポットに関する質問 GitHub 組織があります。 次の図に...
- 質問260 Azure DevOps にプライベート プロジェクトがあります。 プロジ...
- 質問261 あなたの会社は多層Webアプリケーションを構築しています。 >...
- 質問262 Azure DevOpsを使用してiOSアプリケーションを開発しています。 ...
- 質問263 Azure Pipelines に Pipeline1 という名前のパイプラインがあり...
- 質問264 ドラッグアンドドロップの質問 Windows Server 2019 を実行する ...
- 質問265 Azure Boards を使用してプロジェクトを管理します。 現在、item...
- 質問266 ホットスポットに関する質問 次の要件を持つ Azure Data Factory...
- 質問267 Azure DevOps には複数のプロジェクトに取り組む複数のチームが...
- 質問268 ある企業は現在、インシデント管理と変更管理にServiceNowを使用...
- 質問269 Azure DevOps を使用して、Java ベースのアプリケーションのビル...
- 質問270 あなたの会社はAzure DevOpsに新しいWebアプリケーションのプロ...
- 質問271 ドラッグアンドドロップの質問 Azure 仮想マシンを使用する新し...
- 質問272 ケーススタディ3 - ウッドグローブ銀行 概要 概要 Woodgrove Ban...
- 質問273 Contoso という Azure DevOps 組織と Azure サブスクリプション...
- 質問274 AzureにMicrosoftASP.NETCore Webアプリがあり、世界中からアク...
- 質問275 正確かどうかを確認するには、下線部のセグメントを考慮する必要
- 質問276 Azure Pipelines を使用してデプロイされた Azure Web アプリが...
- 質問277 ホットスポットに関する質問 次の表に示すリソースを含む Azure ...
- 質問278 プロビジョニングされたデバイスとプロビジョニングされていない
- 質問279 ドラッグアンドドロップの質問 App Center を使用して、モバイル...
- 質問280 Terraformを使用してAzureリソースグループをデプロイする予定で...
- 質問281 あるチームは現在、アプリケーションのCI/CDプロセスにAzure Pip...
- 質問282 Azure DevOps を使用して、ビルド パイプラインとデプロイ パイ...
- 質問283 Microsoft ASP.NET Coreアプリケーションを作成します。 Azure K...
- 質問284 ドラッグアンドドロップの質問 ATM1 という Azure Traffic Manag...
- 質問285 ホットスポットに関する質問 app.contoso.com というカスタム ド...
- 質問286 ケーススタディ1 - Litware 概要 既存の環境 Litware, Inc.は独...
- 質問287 ドラッグアンドドロップの質問 Azure Repos で新しい Git リポジ...
- 質問288 会社には、Azure DevOpsプロジェクトにリリースパイプラインがあ...
- 質問289 Azure DevOps を利用して、PROJ-01 というプロジェクト用に Azur...
- 質問290 ホットスポットに関する質問 Azure DevOps にリリースパイプライ...
- 質問291 シミュレーション https://dev.azure.com に移動し、[無料で開始...
- 質問292 ソース管理には Git を使用します。 テストに使用する仮想マシン...
- 質問293 ドラッグアンドドロップの質問 GitHub 組織があります。 GitHub ...
- 質問294 ドラッグアンドドロップの質問 repo1 という名前の Azure Repos ...
- 質問295 複数の Windows Server 2016 Azure 仮想マシンにデプロイされる...
- 質問296 Azure Pipelines にビルド パイプラインがあります。 Slack アプ...
- 質問297 Azure Boards を使用してプロジェクトを管理します。 現在、item...
- 質問298 ソース管理には GitHub を使用します。 機密データを含むファイ...
- 質問299 ホットスポットに関する質問 GitHub リポジトリがあります。 リ...
- 質問300 ホットスポットに関する質問 あなたの会社では、Git ソース管理...
- 質問301 WhiteSource Bolt を使用して Node.js アプリケーションをスキャ...
- 質問302 Azure DevOps にリリース パイプラインを持つプロジェクトがあり...
- 質問303 ドラッグアンドドロップの質問 依存関係のバージョン管理戦略と
- 質問304 ケーススタディ2 - Contoso社 背景 Contoso 社はシカゴに本社を...

