- ホーム
- Microsoft
- AZ-400J - Designing and Implementing Microsoft DevOps Solutions (AZ-400日本語版)
- Microsoft.AZ-400J.v2025-08-23.q249
- 質問54
有効的なAZ-400J問題集はJPNTest.com提供され、AZ-400J試験に合格することに役に立ちます!JPNTest.comは今最新AZ-400J試験問題集を提供します。JPNTest.com AZ-400J試験問題集はもう更新されました。ここでAZ-400J問題集のテストエンジンを手に入れます。
AZ-400J問題集最新版のアクセス
「559問、30% ディスカウント、特別な割引コード:JPNshiken」
Azure DevOpsのダッシュボードにプロジェクトメトリックスを推奨する必要があります。
各メトリックに対してどのチャートウィジェットを推奨しますか?回答するには、適切なチャートウィジェットを正しい指標にドラッグします。各チャートウィジェットは、1回、複数回、またはまったく使用しないことができます。コンテンツを表示するには、ペイン間の分割バーをドラッグするか、スクロールする必要があります。
注:それぞれ正しい選択は1ポイントの価値があります。

各メトリックに対してどのチャートウィジェットを推奨しますか?回答するには、適切なチャートウィジェットを正しい指標にドラッグします。各チャートウィジェットは、1回、複数回、またはまったく使用しないことができます。コンテンツを表示するには、ペイン間の分割バーをドラッグするか、スクロールする必要があります。
注:それぞれ正しい選択は1ポイントの価値があります。
正解:
Explanation:
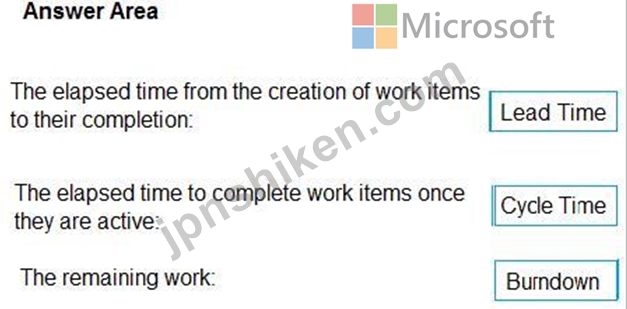
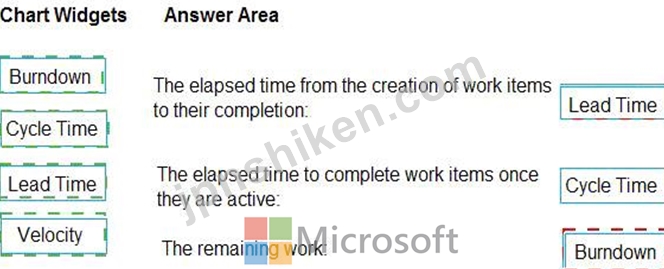
Box 1: Lead time
Lead time measures the total time elapsed from the creation of work items to their completion.
Box 2: Cycle time
Cycle time measures the time it takes for your team to complete work items once they begin actively working onthem.
Box 3: Burndown
Burndown charts focus on remaining work within a specific time period.
References:
https://docs.microsoft.com/en-us/azure/devops/report/dashboards/velocity-guidance?view=vsts
https://docs.microsoft.com/en-us/azure/devops/report/dashboards/cycle-time-and-lead-time?view=vsts
https://docs.microsoft.com/en-us/azure/devops/report/dashboards/configure-burndown-burnup-widgets?
view=vsts

- 質問一覧「249問」
- 質問1 Pipeline1 という名前の Azure Pipelines パイプラインと App1 ...
- 質問2 Azure Monitor で Application Insights を使用してログ データ...
- 質問3 あなたの会社は、大量のデータを処理するクライアントバンキング
- 質問4 Azure Pipelines を使用して、Production-A と Production-B と...
- 質問5 Contosoという名前のAzure DevOps組織、Project1という名前のAzu...
- 質問6 注:この質問は、同じシナリオを提示する一連の質問の一部です。
- 質問7 Azure Repos に Repo1 という名前の Git リポジトリを作成します...
- 質問8 計画された変更をサポートするには、既存のDevOpsツールを置き換...
- 質問9 Azure DevOps に、Azure Boards ボードを使用し、GitHub リポジ...
- 質問10 Azure Pipelines で使用する YAML テンプレートを設計しています...
- 質問11 Azure Application Insightsを使用して、AzureWebアプリの正常性...
- 質問12 アプリケーションのビルドプロセスの一環として、GitHubにあるAz...
- 質問13 Azure DevOps に、User1 と User2 という名前の 2 人のユーザー...
- 質問14 あなたの会社は、すべての Azure Web アプリを 5 時間ごとにバッ...
- 質問15 Azure Pipelines を使用して、Appl という名前のアプリをビルド...
- 質問16 あなたの会社はアプリケーションをDocketコンテナにデプロイしま...
- 質問17 GitHubリポジトリを使用するオープンソースソリューションを開発...
- 質問18 新しいデータベース環境を展開することを計画しています。ソリュ
- 質問19 You have an Azure subscription that contains multiple Azure ...
- 質問20 次の要件を持つ新しいプロジェクトをAzureDevOpsにデプロイする...
- 質問21 Azure Boards を使用してプロジェクトを管理し、Azure Repos を...
- 質問22 投資計画アプリケーションスイートのリリースパイプラインにコー
- 質問23 あなたの会社はAzureとAzure Stackの間にハイブリッドクラウドを...
- 質問24 ホットスポット PowerShell を使用して Azure Log Analytics ワ...
- 質問25 注: この質問は、同じシナリオを提示する一連の質問の一部です。...
- 質問26 ユーザーの行動がアプリケーションに与える影響を理解するために
- 質問27 注:この質問は、同じシナリオを提示する一連の質問の一部です。
- 質問28 注:この質問は同じシナリオを提示する一連の質問の一部です。連
- 質問29 次の図に示すように、Azure DevOps リリース パイプラインがあり...
- 質問30 Project1 という名前の Azure DevOps プロジェクトと Sub1 とい...
- 質問31 Azure Pipelines を使用してコードをビルドおよびテストします。...
- 質問32 Azure Boards プロジェクトと GitHub リポジトリを統合していま...
- 質問33 GitHub Actions を使用する GitHub ワークフローを作成する予定...
- 質問34 AzureDevOpsにProject1という名前のプロジェクトがあります。 Pr...
- 質問35 次の表に示すプロジェクトを含む Azure DevOps サブスクリプショ...
- 質問36 Azure DevOps ビルド パイプラインを含む Azure サブスクリプシ...
- 質問37 Microsoft Visual Studio 2017 が fa-11566895 という名前の Azu...
- 質問38 次の表に示すように、Azure DevOpsで3つのプロジェクト用にAzure...
- 質問39 WS1 という名前の Log Analytics ワークスペースと VM1 という名...
- 質問40 開発プロセスで Azure DevOps を使用する予定です。 既存の開発...
- 質問41 50 台の仮想マシンを含む Azure サブスクリプションがあります。...
- 質問42 Azure DevOps にプロジェクトがあります。 Template1.yml という...
- 質問43 Azure DevOpsにプロジェクトがあります。 Azure DevOpsプロジェ...
- 質問44 タスク 12 以下の機能のみを持つToken!という名前の個人アクセス...
- 質問45 GitHub Enterprise アカウントを持っています。 アカウント リポ...
- 質問46 ソースコードをAzureリポジトリのGitリポジトリに保存します。サ...
- 質問47 50 台の仮想マシンを含む Azure サブスクリプションがあります A...
- 質問48 あなたの会社は新しいアプリケーションのためにAzure DevOpsにプ...
- 質問49 Azure サブスクリプションをお持ちです。 Bicep ファイルを使用...
- 質問50 Contoso RG と Contoso Dev という 2 つのリソース グループ、Co...
- 質問51 ビルドパイプラインを含むAzure DevOpsプロジェクトがあります。...
- 質問52 注:この質問は、同じシナリオを提示する一連の質問の一部です。
- 質問53 Azure DevOpsデプロイパイプラインを構成しています。デプロイさ...
- 質問54 Azure DevOpsのダッシュボードにプロジェクトメトリックスを推奨...
- 質問55 Azure Pipelinesを使用して、プロジェクトのビルドとデプロイを...
- 質問56 あなたの会社はGitベースのソース管理に使用されるオンプレミス...
- 質問57 注:この質問は、同じシナリオを提示する一連の質問の一部です。
- 質問58 注:この質問は同じシナリオを提示する一連の質問の一部です。
- 質問59 チームの展示に示されているように、3つのチームを持つAzure Dev...
- 質問60 ソース管理に GitHub を使用している プロキシを使用して、プラ...
- 質問61 ソース管理には GitHub を使用し、プロジェクト管理には Azure B...
- 質問62 Contosoという名前のAzure DevOps組織とProject1という名前のAzu...
- 質問63 key1 という名前の暗号化キーを含む Azure Key Vault があります...
- 質問64 注:この質問は同じシナリオを提示する一連の質問の一部です。連
- 質問65 リリース パイプラインと Git リポジトリを含む Azure DevOps プ...
- 質問66 repo1 という名前の GitHub リポジトリがあります。 repo1 を re...
- 質問67 Azure Boards を使用してプロジェクトを管理します。 現在、item...
- 質問68 Contoso という名前の Azure DevOps 組織があります。 次の要件...
- 質問69 "MAX_ITEMS" という名前の環境変数を含めるように、az400-994042...
- 質問70 タスク2 Azure DevOps 組織のすべての監査イベントを Log Analyt...
- 質問71 あなたの会社はAzure DevOpsにプロジェクトを持っています。 Azu...
- 質問72 あなたの会社はソフトウェア開発にアジャイルなアプローチを使う
- 質問73 Azure DevOpsにProject1というプロジェクトがあります。事業! I...
- 質問74 Azure SQLデータベースのIntelligent InsightsとAzure Applicati...
- 質問75 タスク 6 デフォルトのメイン ブランチがまだ存在しない場合は、...
- 質問76 あなたの会社では、Java ベースのプロジェクトのビルド パイプラ...
- 質問77 タスク9 デフォルトのメイン ブランチがまだ存在しない場合は初...
- 質問78 あなたの会社は多層Webアプリケーションを構築しています。 >...
- 質問79 AzureDevOpsでプロジェクトを作成することを計画しています。複...
- 質問80 タスク 5 Project1 では、Mermaid 構文を使用して図をレンダリン...
- 質問81 プロビジョニングされたデバイスとプロビジョニングされていない
- 質問82 Azure Pipelinesには、さまざまなジョブを使用して10の異なるア...
- 質問83 az40010480345acr1 という名前のリポジトリが dotnetapp という...
- 質問84 あなたの会社には、サードパーティのパブリッククラウドでLinux...
- 質問85 Azure パイプラインがあります。 構成値を変数として保存する必...
- 質問86 注:この質問は、同じシナリオを提示する一連の質問の一部です。
- 質問87 注: この質問は、同じシナリオを示す一連の質問の一部です。この...
- 質問88 注:この質問は、同じシナリオを提示する一連の質問の一部です。
- 質問89 あなたの会社は、本番環境にデプロイされるApp1という名前のアプ...
- 質問90 タスク 3 Project1 のデフォルトのプロジェクト チーム用に、Das...
- 質問91 注:この質問は、同じシナリオを提示する一連の質問の一部です。
- 質問92 Azure AppServiceでホストされているWebアプリがあります。 Web...
- 質問93 Contoso という名前の Azure DevOps 組織があります。 作業項目...
- 質問94 タスク 4 az400-38443478-dtl1 という名前の DevTest Labs 環境...
- 質問95 Contosoという名前のAzure DevOps組織の無料枠があります。 Cont...
- 質問96 次の定義を持つ Azure Pipelines パイプラインがあります。 (Exh...
- 質問97 注: この質問は、同じシナリオを示す一連の質問の一部です。この...
- 質問98 タスク1 aex.dev.azure.com に移動し、次の資格情報を指定します...
- 質問99 AzurePipelinesとMicrosoftTeamsを統合しています。 AzurePipeli...
- 質問100 az400-9940427-main という名前の Azure Application Insights ...
- 質問101 Azure Artifactsを使用して、Node.jsアプリケーション用のパッケ...
- 質問102 注:この質問は、同じシナリオを提示する一連の質問の一部です。
- 質問103 注:この質問は、同じシナリオを提示する一連の質問の一部です。
- 質問104 アプリをデプロイするには、Azure Pipelines のリリース パイプ...
- 質問105 Azure Artifactsを使用して、作成したNuGetパッケージをホストし...
- 質問106 次の表に示すアプリ用に YAML ベースの Azure パイプラインを設...
- 質問107 次の展示に示すように、AzureMonitorでアラートルールを作成しま...
- 質問108 az400-11566895-main という名前の Azure Web アプリの CI/CD 戦...
- 質問109 注: この質問は、同じシナリオを示す一連の質問の一部です。この...
- 質問110 あなたの会社はAzure DevOpsにプロジェクトを持っています。 展...
- 質問111 Azure DevOpsを使用して、ビルドパイプラインと展開パイプライン...
- 質問112 あなたの会社では新しい Web アプリケーションを構築しています...
- 質問113 共有コードを見つけて分離する必要があります。 共有コードは一
- 質問114 AzureMonitorを使用して監視されるAzure仮想マシンがあります。 ...
- 質問115 Repo1 という名前の GitHub リポジトリがあります。 GitHub Acti...
- 質問116 Azure パイプラインを使用してビルド アーティファクトを公開す...
- 質問117 KV1 という名前の Azure Key Vault と 3 つの Web サーバーがあ...
- 質問118 ソース管理には Get を使用します。 ファイルを削除し、変更をコ...
- 質問119 AzureにMicrosoftASP.NETCore Webアプリがあり、世界中からアク...
- 質問120 User 1. User2 という名前の 3 人のユーザーを含む GitHub 組織...
- 質問121 Azure仮想マシンを使用する新しいアプリケーションをデプロイし...
- 質問122 Azure DevOpsでProject2のコードフロー戦略を実装する必要があり...
- 質問123 あなたの会社はAzureDevOpsを使用しています。 Azure Active Dir...
- 質問124 複数のAzure App Service WebアプリとAzure機能で構成されるアプ...
- 質問125 db1 という名前の Azure SQL データベースに接続する Web アプリ...
- 質問126 Windows Serverを実行するAzure仮想マシンのベースラインメトリ...
- 質問127 Azure Pipelines を使用して、WebApp1 という名前の Azure Web ...
- 質問128 電子商取引 Web サイトをサポートする Azure Web アプリを管理し...
- 質問129 RBACが有効になっているAzure Kubernetes Service(AKS)クラス...
- 質問130 投資計画アプリケーションスイートのビルドエージェントとリリー
- 質問131 Azure Pipelinesでビルドパイプラインを設計しています。 パイプ...
- 質問132 Azure DevOps パイプライン エージェントをホストするには、az40...
- 質問133 あなたの会社はAzure ReposのGitリポジトリを使ってWebアプリケ...
- 質問134 あなたの会社は、AndroidデバイスとOSデバイスをターゲットにし...
- 質問135 Azure Reposで新しいGitリポジトリの設定を構成しています。 マ...
- 質問136 タスク8 az40038443478acr 1 というリポジトリが dotnetapp とい...
- 質問137 ホームページのページ読み込みパフォーマンスに基づいてトリガー
- 質問138 注:この質問は、同じシナリオを提示する一連の質問の一部です。
- 質問139 注:この質問は、同じシナリオを提示する一連の質問の一部です。
- 質問140 Azure DevOpsのダッシュボードにプロジェクトメトリックスを推奨...
- 質問141 Azure Pipelines パイプラインを使用して、Web アプリをビルドお...
- 質問142 Azure DevOps プロセスを使用して、コードをビルドおよびデプロ...
- 質問143 タスク 1 https://dev.azure.com に移動し、[無料で開始] を選択...
- 質問144 .NET アプリケーションのソース管理には GitHub を使用します。 ...
- 質問145 AzureDevOpsに既存のプロジェクトがあります。 プロジェクトのリ...
- 質問146 あなたの会社はOS用のアプリを開発しています。アプリのすべての...
- 質問147 Azure Pipelines に Pipeline1 という名前のパイプラインがあり...
- 質問148 GitHub リポジトリがあります。 Azure DevOps で新しいリポジト...
- 質問149 ASP.NET Coreアプリのコンテナーを作成しています。 イメージを...
- 質問150 プロビジョニングされたデバイスとプロビジョニングされていない
- 質問151 App1を監視するための技術要件を満たす必要があります。何を使う...
- 質問152 GitHub EnterpriseServerをソースコードリポジトリとして使用し...
- 質問153 db1 という名前の Azure SQL データベースに接続する Web アプリ...
- 質問154 POC ブランチをデフォルト ブランチにマージするには !0 が必要...
- 質問155 あなたは3人の顧客のためのプロジェクトを計画しています。 作業...
- 質問156 シミュレーション VM1 という名前の仮想マシンのブート診断を保...
- 質問157 ソース管理には GitHub を使用します。 機密データを含むファイ...
- 質問158 次の図に示すように、Azure Monitor でアラート ルールを作成し...
- 質問159 次の表に示すサービスがあります。 (Exhibit) Azure Boards を使...
- 質問160 投資計画アプリケーションスイートについて、どのパッケージフィ
- 質問161 Azure DevOps プロジェクトがあります。 Azure Resource Manager...
- 質問162 Azure ContainerInstancesで実行されるコンテナー化されたソリュ...
- 質問163 注:この質問は、同じシナリオを提示する一連の質問の一部です。
- 質問164 AzurePipelinesにビルドパイプラインを含むAzureソリューション...
- 質問165 Azure DevOps にプロジェクトがあります。 Template1.yml という...
- 質問166 Project1という名前のプロジェクトを含むAzureDevOps組織があり...
- 質問167 GitHub リポジトリがあります。 v3.0.5 というタグを作成し、リ...
- 質問168 タスク 3 az400-38443478-matn という名前の Azure Web アプリが...
- 質問169 2 つの Azure リージョンでホストされる Web サイトをデプロイす...
- 質問170 タスク3 デフォルトのメイン ブランチがまだ存在しない場合は初...
- 質問171 あなたの会社はTeam Foundation Server 2013(TFS 2013)を使用...
- 質問172 あなたはProject4を実装する必要があります。 あなたは最初に何...
- 質問173 Azure Boards を使用してプロジェクトを管理します。GitHub を使...
- 質問174 Azure DevOpsのプロジェクトにブランドポリシーがあります。ポリ...
- 質問175 GitHubコードの移行を実行する必要があります。ソリューションは...
- 質問176 あなたの会社は、開発者がオープンソースライブラリを導入すると
- 質問177 投資計画アプリケーションスイートのリリース保持ポリシーをどの
- 質問178 Public1 という名前のパブリック GitHub リポジトリがあります。...
- 質問179 あなたのチームはアジャイル開発アプローチを採用しています。
- 質問180 Project5トリガー用のフィルターをどのように構成しますか?回答...
- 質問181 Pool7内のコンピューター用にAzure Automationを構成する必要が...
- 質問182 注: このセクションには、同じシナリオと問題を扱う1つ以上の質...
- 質問183 Azure DevOpsを使用してiOSアプリケーションを開発しています。 ...
- 質問184 あなたの会社はソース管理にGitHubを使用しています。同社には、...
- 質問185 Webapp1という名前のAzureWebアプリがあります。 失敗したWebapp...
- 質問186 注: この質問は、同じシナリオを提示する一連の質問の一部です。...
- 質問187 Application Insights を使用してアプリケーションのパフォーマ...
- 質問188 ソース管理には Get を使用します。 リポジトリのパフォーマンス...
- 質問189 Azure DevOpsを使用して、Javaベースのアプリケーションのビルド...
- 質問190 開発チームは、Microsoft Visual Studioの統合開発環境(IDE)を...
- 質問191 Azure DevOpsビルドパイプラインを構成します。 ホステッドビル...
- 質問192 注: このセクションには、同じシナリオと問題を扱う1つ以上の質...
- 質問193 Desired State Configuration (DSC) を使用して、Windows Server...
- 質問194 Contosoという名前のAzureDevOps組織とartAzureサブスクリプショ...
- 質問195 注: この質問は、同じシナリオを示す一連の質問の一部です。この...
- 質問196 Azure Pipelines を使用して、アプリケーション コードをビルド...
- 質問197 Azure DevOps の Project1 という名前のプロジェクトを含む Azur...
- 質問198 Azure AppServiceでホストされている5つのアプリをサポートする...
- 質問199 Project1という名前のAzure DevOpsプロジェクトと、Sub1という名...
- 質問200 あなたの会社はAzure DevOpsにプロジェクトを持っています。 Azu...
- 質問201 注: この質問は、同じシナリオを示す一連の質問の一部です。この...
- 質問202 あなたの会社では Git ソースコード リポジトリを使用しています...
- 質問203 Contosoという名前のAzure DevOps組織とAzureサブスクリプション...
- 質問204 認証を必要とするMicrosoftASP.NETアプリケーションを構築してい...
- 質問205 注:この質問は同じシナリオを提示する一連の質問の一部です。連
- 質問206 Azure DevOpsを使用して、App1という名前のアプリのビルドとデプ...
- 質問207 あなたの会社はソフトウェア開発にアジャイルアプローチを使うこ
- 質問208 タスク7 Dockerイメージをデプロイするためのパイプラインを作成...
- 質問209 あなたの会社はアジャイル開発方法論を実装しています。 各スプ
- 質問210 Azure Artifactsを使用して、作成、テスト、検証、および展開し...
- 質問211 あなたの会社はWebアプリケーションを作成します。 アプリケーシ...
- 質問212 AzureDevOpsには保護機能があります。 自動テストをテストケース...
- 質問213 App1 という名前のアプリを含む Azure サブスクリプションがあり...
- 質問214 注:この質問は、同じシナリオを提示する一連の質問の一部です。
- 質問215 次の表に示すリポジトリがあります。 (Exhibit) GitHub リポジト...
- 質問216 モバイルアプリケーションでApp Centerを初期化するためのコード...
- 質問217 プライベートGitHubリポジトリがあります。 Azureボード上のリポ...
- 質問218 GitHub でリリースを完成させようとしています。 次のラベルをリ...
- 質問219 投資計画アプリケーションスイートには、どの分岐戦略をお勧めし
- 質問220 注: このセクションには、同じシナリオと問題を扱う1つ以上の質...
- 質問221 複数のマイクロサービスを含むソリューションを展開する予定です
- 質問222 あなたは、単体テストを含む完全な Microsoft .NET Framework ソ...
- 質問223 認証にAzure Active Directory(Azure AD)を使用するようにGitH...
- 質問224 Azure Boards と統合された GitHub リポジトリがある Azure Boar...
- 質問225 AzurePipelinesでビルドパイプラインを作成しています。 サード...
- 質問226 AzureDevOpsダッシュボードを構成しています。ソリューションは...
- 質問227 Azureサブスクリプションがあります。サブスクリプションには、W...
- 質問228 あなたの会社はインシデント管理にService Nowを使っています。 ...
- 質問229 You have a web app named App1 that is hosted on multiple ser...
- 質問230 repo1 という名前の Azure Repos Git リポジトリがあります。 SS...
- 質問231 モバイル アプリケーションが共有を呼び出すために必要なシーク
- 質問232 あなたの会社では、Java ベースのプロジェクトのビルド パイプラ...
- 質問233 4 つの Azure 仮想マシンを含む Azure サブスクリプションがあり...
- 質問234 あなたは多層アプリケーションを開発しています。アプリケーショ
- 質問235 Azure Pipelinesを使用して、ビルドパイプラインを管理します。...
- 質問236 タスク1 az400-38443478-main という名前の Azure Web アプリが...
- 質問237 NuGetパッケージを作成しています。 パッケージを開発チームに非...
- 質問238 RBAC対応クラスターで、HelmとTitleを使用してAzure Kubemets Se...
- 質問239 あなたはアプリケーションを開発しています。アプリケーションの
- 質問240 複数のAzureサービスを含むAzureサブスクリプションがあります。...
- 質問241 App1 という名前の .NET アプリがあります。 App1 を GitHub Pac...
- 質問242 AzurePipelinesとGitHubがソースコードリポジトリとして統合され...
- 質問243 監視には、Azure SQL Database IntelligentInsightsとAzureAppli...
- 質問244 Azure Boards と Azure Repos を使用する Azure サブスクリプシ...
- 質問245 アプリをビルドしてテストし、アプリのデータベースをテストする
- 質問246 注:この質問は同じシナリオを提示する一連の質問の一部です。連
- 質問247 タスク5 署名されたイメージを az40038443478act1 という名前の ...
- 質問248 Windows Serverを実行するAzure仮想マシンにインターネットイン...
- 質問249 Azure Repos の Git リポジトリを使用して、Web アプリケーショ...
