- ホーム
- Microsoft
- AZ-400J - Designing and Implementing Microsoft DevOps Solutions (AZ-400日本語版)
- Microsoft.AZ-400J.v2024-09-30.q229
- 質問160
有効的なAZ-400J問題集はJPNTest.com提供され、AZ-400J試験に合格することに役に立ちます!JPNTest.comは今最新AZ-400J試験問題集を提供します。JPNTest.com AZ-400J試験問題集はもう更新されました。ここでAZ-400J問題集のテストエンジンを手に入れます。
AZ-400J問題集最新版のアクセス
「625問、30% ディスカウント、特別な割引コード:JPNshiken」
Azure DevOps にプロジェクトがあります。
次のメトリックに関する情報を提供するダッシュボードを構成する必要があります。
* 作業項目を閉じるまでにかかる時間
* 完了したバックログ項目の数
* 障害が発生したサービスを復元するのにかかる時間
各メトリクスにはどのタイプのウィジェットを使用する必要がありますか?答えるには、適切なウィジェット タイプを正しいメトリクスにドラッグします。各ウィジェット タイプは、1 回使用することも、複数回使用することも、まったく使用しないこともできます。コンテンツを表示するには、ペイン間で分割バーをドラッグするか、スクロールする必要がある場合があります。 注: 正しく選択するたびに 1 ポイントの価値があります。
正解:
Explanation:
To configure a dashboard that will provide information on the metrics you mentioned, you can use the following types of widgets:
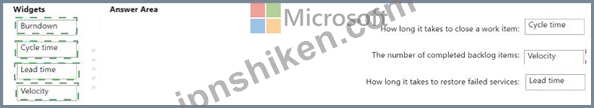
* How long it takes to close a work item: Cycle time. This widget shows the average time it takes for work items to go from a specified start state to a specified end state1.
* The number of completed backlog items: Velocity. This widget shows the amount of work delivered by a team within a sprint or iteration2.
* How long it takes to restore failed services: Lead time. This widget shows the average time it takes for work items to go from creation to completion3.

- 質問一覧「229問」
- 質問1 注: この質問は、同じシナリオを示す一連の質問の一部です。この...
- 質問2 Contosoという名前のAzureDevOps組織とartAzureサブスクリプショ...
- 質問3 次の表に示すサービスがあります。 (Exhibit) Azure Boards を使...
- 質問4 Windows Server 2019 を実行する Azure 仮想マシンが複数ありま...
- 質問5 次の表に示すように、Azure DevOpsで3つのプロジェクト用にAzure...
- 質問6 あなたの会社は、開発者がオープンソースライブラリを導入すると
- 質問7 Azure Pipelines テンプレートの複数のバージョンを含む GitHub ...
- 質問8 Azure Kubernetes Service(App1という名前のアプリをホストする...
- 質問9 Project1という名前のAzure DevOpsプロジェクトとSub1という名前...
- 質問10 チームは Azure Pipelines を使用してアプリケーションをデプロ...
- 質問11 あなたの会社はAzure DevOpsにプロジェクトを持っています。 Azu...
- 質問12 Azure DevOps パイプライン エージェントをホストするには、az40...
- 質問13 Azure DevOpsでは、Project3を作成します。 あなたはプロジェク...
- 質問14 あなたの会社は、次のエンドポイントにアプリケーションをデプロ
- 質問15 投資計画アプリケーションスイートについて、どのパッケージフィ
- 質問16 あなたは会社のテストプロセスを自動化しています。 Web アプリ...
- 質問17 注:この質問は、同じシナリオを提示する一連の質問の一部です。
- 質問18 述べられた目標を達成するかもしれないユニークな解決策。一部の
- 質問19 現在、DevOpsプロセスの一部としてJIRA、Jenkins、およびOctopus...
- 質問20 Vault1 という名前の Azure キー コンテナー、Pipeline1 という...
- 質問21 注:この質問は同じシナリオを提示する一連の質問の一部です。連
- 質問22 投資計画アプリケーションスイートには、どの分岐戦略をお勧めし
- 質問23 Azure パイプラインを使用してビルド アーティファクトを公開す...
- 質問24 注:この質問は同じシナリオを提示する一連の質問の一部です。連
- 質問25 あなたの会社はAzure DevOpsにプロジェクトを持っています。 Azu...
- 質問26 次の要件を持つ新しいプロジェクトをAzureDevOpsにデプロイする...
- 質問27 多層アプリケーションがあります。アプリケーションのフロント
- 質問28 User 1. User2 という名前の 3 人のユーザーを含む GitHub 組織...
- 質問29 パッケージフィードを含むAzure DevOpsプロジェクトを管理します...
- 質問30 Azure DevOpsを使用してiOSアプリケーションを開発しています。 ...
- 質問31 Public1 という名前のパブリック GitHub リポジトリがあります。...
- 質問32 AzureDevOpsには保護機能があります。 自動テストをテストケース...
- 質問33 GitHubでのコードレビュー割り当ての使用を評価しています。 コ...
- 質問34 Azure DevOps ビルド パイプラインを含む Azure サブスクリプシ...
- 質問35 このセクションの質問に回答した後は、その質問に戻ることはでき
- 質問36 会社には、Azure DevOpsプロジェクトにリリースパイプラインがあ...
- 質問37 Azure DevOps にプロジェクトがあります。 Template1.yml という...
- 質問38 注:この質問は同じシナリオを提示する一連の質問の一部です。連
- 質問39 あなたの会社はWebアプリケーションを作成します。 アプリケーシ...
- 質問40 アプリケーションをホストするには、Azure Kubernetes Service(...
- 質問41 Project1という名前のAzure DevOpsプロジェクトと、Sub1という名...
- 質問42 あなたの会社はAzureDevOpsを使用しています。 Azure Active Dir...
- 質問43 GitHub Actions を使用する GitHub ワークフローを作成する予定...
- 質問44 Contosoという名前のAzure DevOps組織とAzureサブスクリプション...
- 質問45 ソース管理には Get を使用します。 テストに使用する仮想マシン...
- 質問46 repo1 という名前の Azure Repos Git リポジトリがあります。 SS...
- 質問47 key1 という名前の暗号化キーを含む Azure Key Vault があります...
- 質問48 ユーザーの行動がアプリケーションに与える影響を理解するために
- 質問49 Azure Pipelines を使用して、Production-A と Production-B と...
- 質問50 注:この質問は同じシナリオを提示する一連の質問の一部です。連
- 質問51 Microsoft ASP.NET Coreアプリケーションを作成します。 Azure K...
- 質問52 あなたの会社はJavaで新しいソリューションを構築しています。 ...
- 質問53 注:この質問は、同じシナリオを提示する一連の質問の一部です。
- 質問54 複数のAzure App Service WebアプリとAzure機能で構成されるアプ...
- 質問55 あなたの会社には、新しいアプリケーション用の Azure DevOps プ...
- 質問56 注:この質問は、同じシナリオを提示する一連の質問の一部です。
- 質問57 あなたの会社は、開発者がオープンソースライブラリを導入すると
- 質問58 10人の新しい開発者をオンボーディングする予定です。 次の要件...
- 質問59 リリース パイプラインと Git リポジトリを含む Azure DevOps プ...
- 質問60 注:この質問は同じシナリオを提示する一連の質問の一部です。連
- 質問61 Azure Pipelinesを使用して、アプリのビルドとデプロイを管理し...
- 質問62 GitHubリポジトリのAzure Pipelinesにパイプラインを含むContoso...
- 質問63 投資計画アプリケーションスイートのリリース保持ポリシーをどの
- 質問64 .NET アプリケーションのソース管理には GitHub を使用します。 ...
- 質問65 複数のマイクロサービスを含むソリューションを展開する予定です
- 質問66 AzurePipelinesでビルドパイプラインを作成しています。 サード...
- 質問67 あなたの会社は、開発者がオープンソースライブラリを導入すると
- 質問68 監視には、Azure SQL Database IntelligentInsightsとAzureAppli...
- 質問69 db1 という名前の Azure SQL データベースに接続する Web アプリ...
- 質問70 Windows Serverを実行するAzure仮想マシンにインターネットイン...
- 質問71 Repo1 という名前の大きなリポジトリがあり、その中に directory...
- 質問72 (Exhibit) あなたの会社では、Azure Application Insights を使...
- 質問73 Azure DevOps に Project1 という名前のプロジェクトがあります...
- 質問74 Azure Application Insightsの可用性テストを構成します。 可用...
- 質問75 Azure Application Insights を使用して、Azure Web アプリの正...
- 質問76 Azure DevOpsを使用して、ビルドパイプラインと展開パイプライン...
- 質問77 Azure Artifactsを使用して、Node.jsアプリケーション用のパッケ...
- 質問78 AzurePipelinesにビルドパイプラインを含むAzureソリューション...
- 質問79 あなたの会社では、ソース管理の取得に Azure DevOps を使用して...
- 質問80 AzureDevOpsへのアクセスを制御するための技術要件を満たす必要...
- 質問81 2 つの Azure リージョンでホストされる Web サイトをデプロイす...
- 質問82 Project1という名前のプロジェクトを含むAzureDevOps組織があり...
- 質問83 複数のリソースグループのリソースを含むAzureサブスクリプショ...
- 質問84 ホストされたビルド リソースがさらに必要です。どうすればよい
- 質問85 注:この質問は同じシナリオを提示する一連の質問の一部です。連
- 質問86 50 台の仮想マシンを含む Azure サブスクリプションがあります A...
- 質問87 Azure Pipelines を使用して、アプリケーション コードをビルド...
- 質問88 あなたの会社はアジャイル開発方法論を実装しています。 各スプ
- 質問89 あなたの会社は、アプリケーションを以下のエンドポイントにデプ
- 質問90 認証を必要とするMicrosoftASP.NETアプリケーションを構築してい...
- 質問91 タスク1 az400-38443478-main という名前の Azure Web アプリが...
- 質問92 あなたの会社はAzure DevOpsに新しいWebアプリケーションのプロ...
- 質問93 Azure Repos に Repo1 という名前の Git リポジトリを作成します...
- 質問94 あなたの会社はJavaで新しいソリューションを構築しています。 ...
- 質問95 VM1のアラートを構成する必要があります。ソリューションは技術...
- 質問96 注:この質問は、同じシナリオを提示する一連の質問の一部です。
- 質問97 注:この質問は、同じシナリオを提示する一連の質問の一部です。
- 質問98 Contosoという名前のAzure DevOps組織とAzureサブスクリプション...
- 質問99 KV1 という名前の Azure Key Vault と 3 つの Web サーバーがあ...
- 質問100 Azure DevOpsにプライベートプロジェクトがあり、User1とUser2と...
- 質問101 Azure Boards プロジェクトと GitHub リポジトリを統合していま...
- 質問102 Project1のビルドエージェントを実装するための手順を推奨する必...
- 質問103 ソース管理には Get を使用します。Appt という名前のアプリがあ...
- 質問104 ソース管理には GitHub を使用し、プロジェクト管理には Azure B...
- 質問105 ソース管理に GitHub を使用している プロキシを使用して、プラ...
- 質問106 このセクションの質問に回答した後は、その質問に戻ることはでき
- 質問107 あなたのチームはアジャイル開発アプローチを採用しています。
- 質問108 az400-11566895-kv という名前の Azure Key Vault に保存されて...
- 質問109 タスク 4 az400-38443478-dtl1 という名前の DevTest Labs 環境...
- 質問110 注: この質問は、同じシナリオを示す一連の質問の一部です。この...
- 質問111 次の図に示すように、Azure DevOps リリース パイプラインがあり...
- 質問112 Azure Pipelinesを使用して、プロジェクトのビルドとデプロイを...
- 質問113 Windows Serverを実行する仮想マシンの構成状態を維持するために...
- 質問114 あなたはProject4を実装する必要があります。 あなたは最初に何...
- 質問115 AzureDevOpsに既存のプロジェクトがあります。 プロジェクトのリ...
- 質問116 Contoso という名前の Azure DevOps 組織があります。 作業項目...
- 質問117 Javaアプリケーションのビルドプロセスの統合戦略を推奨する必要...
- 質問118 Azure SQLデータベースのIntelligent InsightsとAzure Applicati...
- 質問119 注:この質問は、同じシナリオを提示する一連の質問の一部です。
- 質問120 Azure サブスクリプションをお持ちです。 Bicep ファイルを使用...
- 質問121 NuGetパッケージを作成しています。 パッケージを開発チームに非...
- 質問122 アプリケーションのビルドプロセスの一環として、GitHubにあるAz...
- 質問123 ソース管理には Git を使用します。 GitHub コード スキャンを有...
- 質問124 あなたの会社では新しい Web アプリケーションを構築しています...
- 質問125 Node.js アプリのデプロイに使用される Azure DevOps パイプライ...
- 質問126 Azure DevOps に、User1 と User2 という名前の 2 人のユーザー...
- 質問127 App1を監視するための技術要件を満たす必要があります。何を使う...
- 質問128 あなたは3人の顧客のためのプロジェクトを計画しています。 作業...
- 質問129 Azure ContainerInstancesで実行されるコンテナー化されたソリュ...
- 質問130 Azure DevOpsでプロジェクトのセキュリティ検証戦略を設計してい...
- 質問131 図に示すように、Azure DevOpsでリリースパイプラインを構成して...
- 質問132 repo1 という名前の Azure Repos リポジトリがあります。 featur...
- 質問133 注:この質問は、同じシナリオを提示する一連の質問の一部です。
- 質問134 あなたの会社はインシデント管理にService Nowを使っています。 ...
- 質問135 Azure DevOps にプロジェクトがあります。 ダッシュボードを構成...
- 質問136 あなたの会社にはAzure DevOpsプロジェクトがあり、 プロジェク...
- 質問137 あなたの会社は、本番環境にデプロイされるApp1という名前のアプ...
- 質問138 GitHub でリリースを完成させようとしています。 次のラベルをリ...
- 質問139 Azure Pipelines を使用して、コード プロジェクトをビルドおよ...
- 質問140 注: この質問は、同じシナリオを示す一連の質問の一部です。この...
- 質問141 Dockerデプロイモデルを使用するAzure DevOpsパイプラインのイン...
- 質問142 注:この質問は同じシナリオを提示する一連の質問の一部です。連
- 質問143 AzureDevOpsダッシュボードを構成しています。ソリューションは...
- 質問144 あなたは、Azure DevOpsを使用してインフラストラクチャをAzure...
- 質問145 注:この質問は同じシナリオを提示する一連の質問の一部です。
- 質問146 次のAzureポリシーがあります。 (Exhibit)
- 質問147 多くのパッケージフィードを使用するAzure DevOpsプロジェクトが...
- 質問148 Azure Artifactsを使用して、作成、テスト、検証、および展開し...
- 質問149 RBAC対応クラスターで、HelmとTitleを使用してAzure Kubemets Se...
- 質問150 Azure AppServiceでホストされているWebアプリがあります。 Web...
- 質問151 注:この質問は、同じシナリオを提示する一連の質問の一部です。
- 質問152 ソースコードリポジトリとしてGitHubを使用しています。 commit-...
- 質問153 大規模なエンタープライズアプリケーションのGitリポジトリを管...
- 質問154 大規模なエンタープライズアプリケーションのGitリポジトリを管...
- 質問155 注:この質問は、同じシナリオを提示する一連の質問の一部です。
- 質問156 注: この質問は、同じシナリオを示す一連の質問の一部です。この...
- 質問157 コードは GitHub を使用して管理します。 あなたは、Dependabot ...
- 質問158 WS1 という名前の Log Analytics ワークスペースと VM1 という名...
- 質問159 Azure Reposで新しいGitリポジトリの設定を構成しています。 マ...
- 質問160 Azure DevOps にプロジェクトがあります。 次のメトリックに関す...
- 質問161 AzurePipelinesに既存のビルドパイプラインがあります。 パイプ...
- 質問162 Contosoという名前のAzure DevOps組織の無料枠があります。 Cont...
- 質問163 あなたは、署名されたイメージを az4009940427acr1 という名前の...
- 質問164 App1 という名前のアプリがあります。Events と Logs という名前...
- 質問165 あなたの会社には4つのプロジェクトがあります。各プロジェクト
- 質問166 注:この質問は、同じシナリオを提示する一連の質問の一部です。
- 質問167 複数のAzureサービスを含むAzureサブスクリプションがあります。...
- 質問168 Azure DevOps の Project1 という名前のプロジェクトを含む Azur...
- 質問169 .NET Core ランタイム スラックを使用する webapp1 という名前の...
- 質問170 注: この質問は、同じシナリオを示す一連の質問の一部です。この...
- 質問171 あなたの会社は、大量のデータを処理するクライアントバンキング
- 質問172 Azure DevOps のプロジェクトで NuGet パッケージを使用する予定...
- 質問173 Azure Boards でダッシュボードを作成しています。 作業項目の作...
- 質問174 注:この質問は、同じシナリオを提示する一連の質問の一部です。
- 質問175 会社の開発プロセスを設計しています。 問題があることがわかっ
- 質問176 Azure DevOpsにプロジェクトがあります。 Azure DevOpsプロジェ...
- 質問177 Azureサブスクリプションがあります。サブスクリプションには、W...
- 質問178 ビルドパイプラインを含むAzure DevOpsプロジェクトがあります。...
- 質問179 GitHub を使用してソース コードの管理とバージョン管理を管理し...
- 質問180 注:この質問は、同じシナリオを提示する一連の質問の一部です。
- 質問181 会社の開発チーム向けにAzure DevOps戦略を設計しています。 技...
- 質問182 "MAX_ITEMS" という名前の環境変数を含めるように、az400-994042...
- 質問183 投資計画アプリケーションスイートのリリースパイプラインにコー
- 質問184 あなたの会社には、Azure DevOps に Project1 という名前のプロ...
- 質問185 あなたの会社では Git ソースコード リポジトリを使用しています...
- 質問186 org1という名前のGitHub組織と、Tenant1という名前のAzureテナン...
- 質問187 Terraformを使用してAzureリソースグループをデプロイする予定で...
- 質問188 RG1lod11566895 という名前のリソース グループ内の db1 という...
- 質問189 コードレビューの間に、あなたは多くの品質問題を発見します。多
- 質問190 注:この質問は、同じシナリオを提示する一連の質問の一部です。
- 質問191 シミュレーション VM1 という名前の仮想マシンのブート診断を保...
- 質問192 Azure PipelinesとMicrosoft Teamsを統合しています。 Microsoft...
- 質問193 あなたの会社はAzure DevOpsにプロジェクトを持っています。 展...
- 質問194 Web ブックを含む Azure Automation アカウントがあります。Webb...
- 質問195 Azure Pipelinesでビルドパイプラインを設計しています。 パイプ...
- 質問196 投資計画アプリケーションスイートのビルドエージェントとリリー
- 質問197 Azure Pipelinesを使用して、ビルドパイプラインを管理します。...
- 質問198 Microsoft Visual Studio 2017 が fa-11566895 という名前の Azu...
- 質問199 セルフホストのLinuxエージェントをプロビジョニングする予定で...
- 質問200 az400-9940427-main という名前の Azure Web アプリが、システム...
- 質問201 モバイルアプリケーションでApp Centerを初期化するためのコード...
- 質問202 あなたの会社はアプリケーションをDocketコンテナにデプロイしま...
- 質問203 Azure Kubernetes Service (AKS) クラスターのデプロイメント フ...
- 質問204 このセクションの質問に回答した後は、その質問に戻ることはでき
- 質問205 Azure DevTest Labs 環境に az400-9940427-dtl1 という名前の仮...
- 質問206 ワークフローを含む GitHub リポジトリがあります。ワークフロー...
- 質問207 AzureDevOpsでプロジェクトを作成することを計画しています。複...
- 質問208 GitHub を使用してソース コードの管理とバージョン管理を管理し...
- 質問209 az400-11566895-main という名前の Azure Web アプリの CI/CD 戦...
- 質問210 Azure Pipelines で使用する YAML テンプレートを設計しています...
- 質問211 電子商取引 Web サイトをサポートする Azure Web アプリを管理し...
- 質問212 多層アプリケーションを展開するAzure Resource Managerテンプレ...
- 質問213 ソースコードをAzureリポジトリのGitリポジトリに保存します。サ...
- 質問214 次の表に示すように、2つのアプリケーションの承認方針を定義し
- 質問215 注: この質問は、同じシナリオを示す一連の質問の一部です。この...
- 質問216 User1 という名前のユーザーを含む Azure サブスクリプションが...
- 質問217 .NET Core ランタイム スタックを使用する webapp1 という名前の...
- 質問218 タスク 3 az400-38443478-matn という名前の Azure Web アプリが...
- 質問219 Windows Serverを実行するAzure仮想マシンのベースラインメトリ...
- 質問220 リリース パイプラインを含むプロジェクトが Azure DevOps にあ...
- 質問221 RBACが有効になっているAzure Kubernetes Service(AKS)クラス...
- 質問222 コードは GitHub を使用して管理します。 新しい脆弱な依存関係...
- 質問223 Azure Boards を使用してプロジェクトを管理します。 現在、item...
- 質問224 ビルドパイプラインを含むAzure DevOpsプロジェクトがあります。...
- 質問225 ホームページのページ読み込みパフォーマンスに基づいてトリガー
- 質問226 開発チームは、Microsoft Visual Studioの統合開発環境(IDE)を...
- 質問227 注:この質問は同じシナリオを提示する一連の質問の一部です。連
- 質問228 注:この質問は、同じシナリオを提示する一連の質問の一部です。
- 質問229 注:この質問は、同じシナリオを提示する一連の質問の一部です。
