- ホーム
- Microsoft
- AZ-400J - Designing and Implementing Microsoft DevOps Solutions (AZ-400日本語版)
- Microsoft.AZ-400J.v2024-03-25.q210
- 質問26
有効的なAZ-400J問題集はJPNTest.com提供され、AZ-400J試験に合格することに役に立ちます!JPNTest.comは今最新AZ-400J試験問題集を提供します。JPNTest.com AZ-400J試験問題集はもう更新されました。ここでAZ-400J問題集のテストエンジンを手に入れます。
AZ-400J問題集最新版のアクセス
「625問、30% ディスカウント、特別な割引コード:JPNshiken」
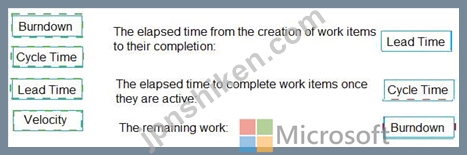
Azure DevOpsのダッシュボードにプロジェクトメトリックスを推奨する必要があります。
各メトリックに対してどのチャートウィジェットを推奨しますか?回答するには、適切なチャートウィジェットを正しい指標にドラッグします。各チャートウィジェットは、1回、複数回、またはまったく使用しないことができます。コンテンツを表示するには、ペイン間の分割バーをドラッグするか、スクロールする必要があります。
注:それぞれ正しい選択は1ポイントの価値があります。

各メトリックに対してどのチャートウィジェットを推奨しますか?回答するには、適切なチャートウィジェットを正しい指標にドラッグします。各チャートウィジェットは、1回、複数回、またはまったく使用しないことができます。コンテンツを表示するには、ペイン間の分割バーをドラッグするか、スクロールする必要があります。
注:それぞれ正しい選択は1ポイントの価値があります。
正解:
Explanation:
Graphical user interface, text, application, chat or text message Description automatically generated
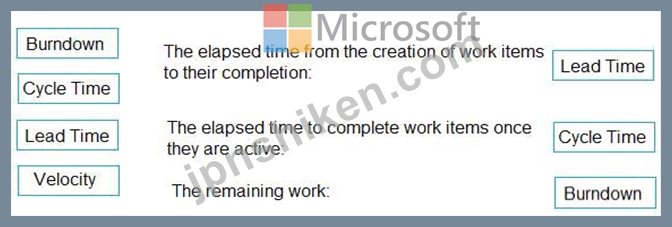
Box 1: Lead time
Lead time measures the total time elapsed from the creation of work items to their completion.
Box 2: Cycle time
Cycle time measures the time it takes for your team to complete work items once they begin actively working on them.
Box 3: Burn down
Burn down charts focus on remaining work within a specific time period.
Reference:
https://docs.microsoft.com/en-us/azure/devops/report/dashboards/velocity-guidance?view=vsts
https://docs.microsoft.com/en-us/azure/devops/report/dashboards/cycle-time-and-lead-time?view=vsts
https://docs.microsoft.com/en-us/azure/devops/report/dashboards/configure-burndown-burnup-widgets?view=vs

- 質問一覧「210問」
- 質問1 ASP.NET Core アプリケーションを構築しています。 テレメトリ ...
- 質問2 Azure DevOps を使用して、Java ベースのアプリケーションのビル...
- 質問3 注:この質問は、同じシナリオを提示する一連の質問の一部です。
- 質問4 Azure DevOps で新しいプロジェクトを実装しています。 保護のパ...
- 質問5 あなたの会社は3つのモバイルアプリケーションのスイートを作成
- 質問6 db1 という名前の Azure SQL Database を使用するアプリがいくつ...
- 質問7 KV1 という名前の Azure Key Vault と 3 つの Web サーバーがあ...
- 質問8 アプリケーションのビルドプロセスの一環として、GitHubにあるAz...
- 質問9 Azure DevOps パイプライン エージェントをホストするには、az40...
- 質問10 あなたの会社は、開発者がオープンソースライブラリを導入すると
- 質問11 次の展示に示すように、AzureMonitorでアラートルールを作成しま...
- 質問12 Azure DevOps のプロジェクトで NuGet パッケージを使用する予定...
- 質問13 ソース管理には GitHub を使用し、プロジェクト管理には Azure B...
- 質問14 投資計画アプリケーションスイートのリリース保持ポリシーをどの
- 質問15 次の表に示すリソースを含むAzureサブスクリプションがあります...
- 質問16 次の表に示すように、Azure DevOpsで3つのプロジェクト用にAzure...
- 質問17 RBACが有効になっているAzure Kubernetes Service(AKS)クラス...
- 質問18 次のAzureポリシーがあります。 (Exhibit) ポリシーをテナントの...
- 質問19 Vault1 という名前の Azure キー コンテナーを含む Azure サブス...
- 質問20 D:\Deploy.json という名前のテンプレートを Deploy-lod9940427 ...
- 質問21 あなたの会社には、ノード パッケージ マネージャー (npm) パッ...
- 質問22 あなたの会社はインシデント管理にServiceNowを使用しています。...
- 質問23 Contosoという名前のAzure DevOps組織とAzureサブスクリプション...
- 質問24 多層アプリケーションがあります。アプリケーションのフロント
- 質問25 あなたの会社はソフトウェア開発にアジャイルなアプローチを使う
- 質問26 Azure DevOpsのダッシュボードにプロジェクトメトリックスを推奨...
- 質問27 監視には、Azure SQL Database IntelligentInsightsとAzureAppli...
- 質問28 あなたの会社はAzure DevOpsを使用して、アプリケーションのビル...
- 質問29 あなたの会社には4つのプロジェクトがあります。各プロジェクト
- 質問30 az400-9940427-main という名前の Azure Web アプリが、システム...
- 質問31 Pipeline1 という名前の Azure パイプラインと Repo1 という名前...
- 質問32 Azure Application Insightsを使用して、AzureWebアプリの正常性...
- 質問33 Azure Boards を使用してプロジェクトを管理します。プロジェク...
- 質問34 大規模なエンタープライズアプリケーションのGitリポジトリを管...
- 質問35 あなたの会社はJavaで新しいソリューションを構築しています。 ...
- 質問36 Azure Web Apps フロントエンドと Azure SQL Dataable バックエ...
- 質問37 "MAX_ITEMS" という名前の環境変数を含めるように、az400-994042...
- 質問38 You have a web app named App1 that is hosted on multiple ser...
- 質問39 あなたは多層アプリケーションを開発しています。アプリケーショ
- 質問40 大きな PSD ファイルを含む Azure Repos リポジトリがあります。...
- 質問41 開発チームは、Microsoft Visual Studioの統合開発環境(IDE)を...
- 質問42 投資計画アプリケーションスイートのリリースパイプラインにコー
- 質問43 投資計画アプリケーションスイートには、どの分岐戦略をお勧めし
- 質問44 Azure Pipelinesにビルドパイプラインがあります。 Slackアプリ...
- 質問45 Azure DevOpsビルドパイプラインを構成します。 ホステッドビル...
- 質問46 Azure Monitor を使用し、Log Analytics ワークスペースを含む A...
- 質問47 注:この質問は、同じシナリオを提示する一連の質問の一部です。
- 質問48 Project1という名前のAzure DevOpsプロジェクトと、Sub1という名...
- 質問49 Azure DevOps にプロジェクトがあります。 ダッシュボードを構成...
- 質問50 .NET Core ランタイム スタックを使用する webapp1 という名前の...
- 質問51 パッケージフィードを含むAzure DevOpsプロジェクトを管理します...
- 質問52 Azure Monitor で Application Insights を使用してログ データ...
- 質問53 複数のAzureサービスを含むAzureサブスクリプションがあります。...
- 質問54 あなたの会社はアプリケーションをDocketコンテナにデプロイしま...
- 質問55 あなたの会社では、Java ベースのプロジェクトのビルド パイプラ...
- 質問56 GitHubコードの移行を実行する必要があります。ソリューションは...
- 質問57 ビルドとリリースのパイプラインは、Azure DevOpsを使用して管理...
- 質問58 ソース管理には Get を使用します。 ファイルを削除し、変更をコ...
- 質問59 ビルドパイプラインを含むAzure DevOpsプロジェクトがあります。...
- 質問60 あなたの会社はJavaで新しいソリューションを構築しています。 ...
- 質問61 あなたの会社では、ソース管理の取得に Azure DevOps を使用して...
- 質問62 あなたの会社はAzureDevOpsを使用しています。 Azure Active Dir...
- 質問63 コードレビュー中に、Javaアプリケーションの品質の問題を発見し...
- 質問64 ホームページのページ読み込みパフォーマンスに基づいてトリガー
- 質問65 NuGetパッケージを作成しています。 パッケージを開発チームに非...
- 質問66 Azure パイプラインを使用してビルド アーティファクトを公開す...
- 質問67 Contosoという名前のAzure DevOps組織、Project1という名前のAzu...
- 質問68 AzurePipelinesとGitHubがソースコードリポジトリとして統合され...
- 質問69 Azure DevOpsにプライベートプロジェクトがあり、User1とUser2と...
- 質問70 Azure DevOps を使用して、Kubernetes クラスターでホストされる...
- 質問71 転送要件を満たすには、Azure DevOpsエージェントプールへのアク...
- 質問72 4 つの Azure 仮想マシンを含む Azure サブスクリプションがあり...
- 質問73 Azure Pipelines を使用して、コード プロジェクトをビルドおよ...
- 質問74 注:この質問は、同じシナリオを提示する一連の質問の一部です。
- 質問75 アプリのソース コードを含む GitHub リポジトリがあります。 ソ...
- 質問76 注:この質問は同じシナリオを提示する一連の質問の一部です。
- 質問77 あなたはProject4を実装する必要があります。 あなたは最初に何...
- 質問78 VM1のアラートを構成する必要があります。ソリューションは技術...
- 質問79 リリース パイプラインを含むプロジェクトが Azure DevOps にあ...
- 質問80 VM1 という名前の仮想マシンのブート診断を保存するには、RG1lod...
- 質問81 あなたはアプリケーションを開発しています。アプリケーションの
- 質問82 セルフホストのLinuxエージェントをプロビジョニングする予定で...
- 質問83 Azure Artifactsを使用して、作成、テスト、検証、および展開し...
- 質問84 次の表に示すリソースを含む Azure サブスクリプションがありま...
- 質問85 Application Insights を使用してアプリケーションのパフォーマ...
- 質問86 App1 という名前のコードを保存する repo1 という名前の GitHub ...
- 質問87 あなたの会社はGitソースコードリポジトリを使用しています。 ワ...
- 質問88 注:この質問は同じシナリオを提示する一連の質問の一部です。連
- 質問89 あなたの会社では、App1という名前の複雑なアプリのソースコード...
- 質問90 Contosoという名前のAzure DevOps組織の無料枠があります。 Cont...
- 質問91 あなたは、署名されたイメージを az4009940427acr1 という名前の...
- 質問92 Azure ApplicationInsightsとWebアプリの共有サービスプラン層を...
- 質問93 Azure DevOps にプロジェクトがあります。 Template1.yml という...
- 質問94 すべての開発者がカスタム パッケージを利用できるようにする必
- 質問95 現在の技術的な問題を解決するには、Register-AzureRmAutomation...
- 質問96 あなたの会社はAzureサブスクリプションを持っています。 会社は...
- 質問97 Webapp1という名前のAzureWebアプリがあります。 失敗したWebapp...
- 質問98 Contosoという名前のAzure DevOps組織とAzureサブスクリプション...
- 質問99 (Exhibit) あなたの会社は新しい Web アプリケーションを構築し...
- 質問100 Contoso という名前の Azure DevOps 組織があります。 Windows S...
- 質問101 あなたの会社はAzure DevOpsにプロジェクトを持っています。 Azu...
- 質問102 このセクションの質問に回答した後は、その質問に戻ることはでき
- 質問103 注:この質問は、同じシナリオを提示する一連の質問の一部です。
- 質問104 プロビジョニングされたデバイスとプロビジョニングされていない
- 質問105 次の表に示すように、2つのアプリケーションの承認方針を定義し
- 質問106 GitHub EnterpriseServerをソースコードリポジトリとして使用し...
- 質問107 あなたの会社はインシデント管理にService Nowを使っています。 ...
- 質問108 あなたの会社には、サードパーティのパブリッククラウドでLinux...
- 質問109 AzureDevOpsにProject1という名前のプロジェクトがあります。 Pr...
- 質問110 Windows Server 2019 を実行し、Desired State Configuration (D...
- 質問111 Project5トリガー用のフィルターをどのように構成しますか?回答...
- 質問112 GitHub Actions を使用する GitHub ワークフローを作成する予定...
- 質問113 あなたの会社は、新しい Azure DevOps チームを作成します。 D18...
- 質問114 Azure DevOpsでProject2のコードフロー戦略を実装する必要があり...
- 質問115 az400-11566895-kv という名前の Azure Key Vault に保存されて...
- 質問116 (Exhibit) Azure Kubernetes Service (AKS) ポッドがあります。 ...
- 質問117 RBAC対応のAzure Kubermets Service(AKS)実装があります。AKS...
- 質問118 注:この質問は、同じシナリオを提示する一連の質問の一部です。
- 質問119 ホットスポット PowerShell を使用して Azure Log Analytics ワ...
- 質問120 app.contoso.comのカスタムドメインを持つApp1という名前のアプ...
- 質問121 Azure DevOps には複数のプロジェクトに取り組む複数のチームが...
- 質問122 複数のAzureActive Directory(Azure AD)アカウントがあります...
- 質問123 注:この質問は同じシナリオを提示する一連の質問の一部です。連
- 質問124 あなたの会社はAzureでWebアプリケーションをホストしています。...
- 質問125 Contosoという名前のAzure DevOps組織とProject1という名前のAzu...
- 質問126 注: この質問は、同じシナリオを示す一連の質問の一部です。この...
- 質問127 Azure DevOps にプロジェクトがあります。 プル リクエストに関...
- 質問128 Azure Kubernetes Service(App1という名前のアプリをホストする...
- 質問129 Azure Kubernetes Service(AKS)クラスターがあります。 Azure ...
- 質問130 あなたの会社はWebアプリケーションを作成します。 アプリケーシ...
- 質問131 あなたの会社はWebアプリケーションを作成します。 アプリケーシ...
- 質問132 Contoso という名前の Azure DevOps 組織があります。 次の要件...
- 質問133 Azure AppServiceでホストされている5つのアプリをサポートする...
- 質問134 リリース パイプラインと Git リポジトリを含む Azure DevOps プ...
- 質問135 Azure DevOps に Project1 という名前のプロジェクトがあります...
- 質問136 あなたの会社はAzure DevOpsにプロジェクトを持っています。 Azu...
- 質問137 Project1 という名前の Azure DevOps プロジェクトと Sub1 とい...
- 質問138 注:この質問は同じシナリオを提示する一連の質問の一部です。連
- 質問139 注: この質問は、同じシナリオを示す一連の質問の一部です。この...
- 質問140 Node.js アプリのデプロイに使用される Azure DevOps パイプライ...
- 質問141 Azure Artifactsを使用して、Node.jsアプリケーション用のパッケ...
- 質問142 Contoso という名前の Azure DevOps 組織があります。 作業項目...
- 質問143 計画された変更をサポートするには、既存のDevOpsツールを置き換...
- 質問144 多くのパッケージフィードを使用するAzure DevOpsプロジェクトが...
- 質問145 App1の認証を構成する必要があります。ソリューションは、計画さ...
- 質問146 ホットスポット Linux を実行する VM1 という名前の Azure 仮想...
- 質問147 注:この質問は同じシナリオを提示する一連の質問の一部です。連
- 質問148 あなたの会社は、すべての Azure Web アプリを 5 時間ごとにバッ...
- 質問149 Azure Pipelines を使用して、アプリケーション コードをビルド...
- 質問150 Azure DevOpsデプロイパイプラインを構成しています。デプロイさ...
- 質問151 チームは Azure Pipelines を使用してアプリケーションをデプロ...
- 質問152 このセクションの質問に回答した後は、その質問に戻ることはでき
- 質問153 複数のリソースグループのリソースを含むAzureサブスクリプショ...
- 質問154 あなたの会社は、パッケージ管理にAzure Artifactsを使用してい...
- 質問155 POC ブランチをデフォルト ブランチにマージするには !0 が必要...
- 質問156 Project1のビルドエージェントを実装するための手順を推奨する必...
- 質問157 Dockerデプロイモデルを使用するAzure DevOpsパイプラインのイン...
- 質問158 GitHub Enterprise アカウントを持っています。 アカウント リポ...
- 質問159 ソース管理には GitHub を使用します。 機密データを含むファイ...
- 質問160 AzureにMicrosoftASP.NETCore Webアプリがあり、世界中からアク...
- 質問161 注:この質問は、同じシナリオを提示する一連の質問の一部です。
- 質問162 Azure Pipelinesには、さまざまなジョブを使用して10の異なるア...
- 質問163 Azure コンテナー レジストリを含む Azure サブスクリプションが...
- 質問164 ワークフローを含む GitHub リポジトリがあります。ワークフロー...
- 質問165 Pool7内のコンピューター用にAzure Automationを構成する必要が...
- 質問166 ソース管理に GitHub を使用している プロキシを使用して、プラ...
- 質問167 注:この質問は、同じシナリオを提示する一連の質問の一部です。
- 質問168 ソースコードリポジトリとしてGitHubを使用しています。 commit-...
- 質問169 User 1. User2 という名前の 3 人のユーザーを含む GitHub 組織...
- 質問170 投資計画アプリケーションスイートのビルドエージェントとリリー
- 質問171 注:この質問は、同じシナリオを提示する一連の質問の一部です。
- 質問172 Azure SQLデータベースのIntelligent InsightsとAzure Applicati...
- 質問173 App1 という名前のアプリがあります。Events と Logs という 2 ...
- 質問174 Azure AppServiceでホストされているWebアプリがあります。 Web...
- 質問175 Azure DevOpsでは、Project3を作成します。 あなたはプロジェク...
- 質問176 50 台の仮想マシンを含む Azure サブスクリプションがあります A...
- 質問177 Contosoという名前のAzureDevOps組織とartAzureサブスクリプショ...
- 質問178 あなたの会社には、新しいアプリケーション用の Azure DevOps プ...
- 質問179 アプリケーションをホストするには、Azure Kubernetes Service(...
- 質問180 複数のAzure App Service WebアプリとAzure機能で構成されるアプ...
- 質問181 AzureDevOpsへのアクセスを制御するための技術要件を満たす必要...
- 質問182 あなたはProject6を実装する必要があります。 どの3つのアクショ...
- 質問183 Azure Boards プロジェクトと GitHub リポジトリを統合していま...
- 質問184 注:この質問は同じシナリオを提示する一連の質問の一部です。連
- 質問185 Azure DevOps ビルド パイプラインを含む Azure サブスクリプシ...
- 質問186 GitHub でリリースを完成させようとしています。 次のラベルをリ...
- 質問187 注:この質問は、同じシナリオを提示する一連の質問の一部です。
- 質問188 Azure DevOpsを使用して、ビルドパイプラインと展開パイプライン...
- 質問189 Azure DevOpsを使用して、Javaベースのアプリケーションのビルド...
- 質問190 あなたの会社はAzure DevOpsに新しいWebアプリケーションのプロ...
- 質問191 Project 1という名前のプロジェクトを含むContosoという名前のAz...
- 質問192 Azure DevOpsのダッシュボードにプロジェクトメトリックスを推奨...
- 質問193 次の要件を持つ新しいプロジェクトをAzureDevOpsにデプロイする...
- 質問194 Azure Pipelinesにビルドパイプラインがあり、失敗することがあ...
- 質問195 ソース管理には Git を使用します。 GitHub コード スキャンを有...
- 質問196 Windows Server 2019を実行するAzure仮想マシンがいくつかありま...
- 質問197 Azure DevOps に Project1 という名前のプロジェクトがあります...
- 質問198 あなたの会社はGitベースのソース管理に使用されるオンプレミス...
- 質問199 注: この質問は、同じシナリオを示す一連の質問の一部です。この...
- 質問200 az400-9940427-func1 という名前の App Service プランでホスト...
- 質問201 共有コードを見つけて分離する必要があります。 共有コードは一
- 質問202 あなたの会社はAzureとAzure Stackの間にハイブリッドクラウドを...
- 質問203 WhiteSourceを使用してスキャンした50のNode.jsベースのプロジェ...
- 質問204 あなたの会社はJavaで新しいソリューションを構築しています。 ...
- 質問205 AzureDevOpsにプロジェクトがあります。 無人構成スクリプトを使...
- 質問206 RG1lod11566895 という名前のリソース グループ内の db1 という...
- 質問207 注:この質問は、同じシナリオを提示する一連の質問の一部です。
- 質問208 Azure Reposで新しいGitリポジトリの設定を構成しています。 マ...
- 質問209 RG1という名前のリソースグループを含むAzureサブスクリプション...
- 質問210 AzurePipelinesにビルドパイプラインを含むAzureソリューション...
