- ホーム
- Microsoft
- AI-102J - Designing and Implementing a Microsoft Azure AI Solution (AI-102日本語版)
- Microsoft.AI-102J.v2026-10-24.q204
- 質問145
有効的なAI-102J問題集はJPNTest.com提供され、AI-102J試験に合格することに役に立ちます!JPNTest.comは今最新AI-102J試験問題集を提供します。JPNTest.com AI-102J試験問題集はもう更新されました。ここでAI-102J問題集のテストエンジンを手に入れます。
AI-102J問題集最新版のアクセス
「425問、30% ディスカウント、特別な割引コード:JPNshiken」
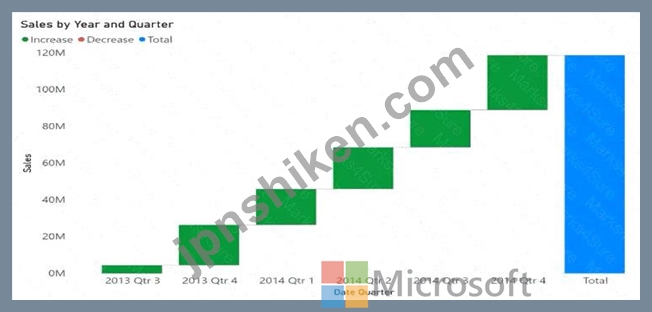
次の展示に示すように、四半期ごとの現在の売上合計の視覚化を作成する必要があります。
CowerBlDesktopで何を作成する必要がありますか;1
CowerBlDesktopで何を作成する必要がありますか;1
正解:A
The exhibit shows incremental increases by quarter leading to a cumulative running total , which is best represented with a waterfall chart .
Ribbon chart shows ranking changes over time, not cumulative totals.
Bar chart shows simple comparisons, not running totals.
Decomposition tree is for drill-down analysis, not running totals.
Reference: Waterfall chart in Power BI
Ribbon chart shows ranking changes over time, not cumulative totals.
Bar chart shows simple comparisons, not running totals.
Decomposition tree is for drill-down analysis, not running totals.
Reference: Waterfall chart in Power BI

- 質問一覧「204問」
- 質問1 英語(英国)で行われた講義を録画するサービスを開発しています
- 質問2 あなたは、スキャンされた経費精算書を処理し、以下のデータを抽
- 質問3 あなたはAzureサブスクリプションをお持ちです。 あなたは、Azur...
- 質問4 注文状況に関する顧客からの電話に応答するアプリを構築していま
- 質問5 Resource1 という名前の Azure Al Language リソースを含む Azur...
- 質問6 テキスト処理ソリューションを開発しています。 次の方法を開発
- 質問7 アプリケーションの Text Analytics 出力を調べています。 分析...
- 質問8 Microsoft Power Biページ付けレポートを作成するには何を使用す...
- 質問9 ユーザーサポートシステムの言語理解モデルをトレーニングしてい
- 質問10 外出先でのショッピング プロジェクトを開発しています。 QnA Ma...
- 質問11 All という名前の Azure OpenAl リソースと CS1 という名前の Az...
- 質問12 A1 AH という Azure OpenA1 リソースがあり、GPT 3.5 モデルの 3...
- 質問13 SO 層に Aldoc1 という名前の Azure Al Document Intelligence ...
- 質問14 Language Understanding ポータルを使用して、Language Understa...
- 質問15 AH という名前の Azure OpenAI リソースを含む Azure サブスクリ...
- 質問16 ストリーミングワークロードの例はどのシナリオですか?
- 質問17 チャットボットがユーザー入力を適切なカテゴリに分類できること
- 質問18 Microsoft Bot Framework を使用して構築され、Azure にデプロイ...
- 質問19 テキスト処理ソリューションを開発しています。 以下に示す関数
- 質問20 文を正しく完成させる答えを選択してください。 (Exhibit)...
- 質問21 言語理解ソリューションを構築しています。 多くのインテントに
- 質問22 Azure サブスクリプションをお持ちです。 スキャンしたドキュメ...
- 質問23 スキャンした請求書の画像が5,000枚保存されているファイル共有...
- 質問24 Computer Vision API を使用して画像を分析するアプリがあります...
- 質問25 過去 24 時間のセンサー データの異常を検出するソリューション...
- 質問26 Azure Cognitive Service for Language の質問回答を使用するチ...
- 質問27 次の JSON を使用して、Azure Cognitive Search のナレッジ スト...
- 質問28 何千もの画像を含むライブラリがあります。 画像に写真、図面、
- 質問29 Computer Visionクライアントライブラリを使用するアプリケーシ...
- 質問30 画像が 100,000 枚あります。 次のアクションを実行するアプリを...
- 質問31 スキャンした雑誌記事100万件を収録したアプリを開発しています...
- 質問32 テスト用ローカル デバイスとオンプレミス データセンターで、コ...
- 質問33 Azure Cognitive Search のインデックス作成用の管理ポータルと...
- 質問34 会社の製品のレビューに基づいてワード クラウドを生成するソリ
- 質問35 予期しないオペレーティングシステムの再起動時にデータベースへ
- 質問36 発信者の母国語で応答できる自動通話処理システムを開発する必要
- 質問37 Azure サブスクリプションをお持ちです。このサブスクリプション...
- 質問38 コンテンツ管理システムを設計しています。 失読症などの総合的
- 質問39 lu1 という名前の Language Understanding リソースがあります。...
- 質問40 Appl という名前の Azure App Service アプリを含む Azure サブ...
- 質問41 Azure Al Language のカスタム質問回答サービスを使用するチャッ...
- 質問42 次の表に示すファイルが含まれるコンピューターがあります。 (Ex...
- 質問43 タスク追跡をサポートするチャットボットを構築する予定です。 I...
- 質問44 Computer Vision API の呼び出しから取得した結果を検証するため...
- 質問45 コンテナにデプロイされた、app1 という名前の会話型言語理解ア...
- 質問46 AH という名前の Azure OpenA1 リソースを含む Azure サブスクリ...
- 質問47 Translator1 という名前のマルチサービス Azure Cognitive Servi...
- 質問48 10,000件のPDF文書を含むトレーニングデータセットがあります。...
- 質問49 Foundry ToolsサービスのAzure言語でカスタム質問応答機能を使用...
- 質問50 AI1 という名前の Azure OpenAI リソースを含む Azure サブスク...
- 質問51 QA1 という名前の Azure Al Language カスタム質問応答プロジェ...
- 質問52 Azure AI Language サービスを使用してテキストを処理しています...
- 質問53 Azure OpenA1 リソースを含む Azure サブスクリプションがあり、...
- 質問54 Azure サブスクリプションをお持ちです。 地理的な場所を認識す...
- 質問55 画像内のオブジェクトを検出するモデルを構築しています。 トレ
- 質問56 Hub1 という名前の Microsoft Foundry ハブ、resource1 という名...
- 質問57 Resource1 という名前の Azure Al コンテンツ セーフティ リソー...
- 質問58 Microsoft Bot Frameworkを使用して、ローカルコンピューター上...
- 質問59 Azure AI Vision API を使用して画像を分析するアプリを開発して...
- 質問60 Azure Cognitive Search を使用してナレッジベースを開発してい...
- 質問61 注: この問題は、同じシナリオを提示する一連の問題の一部です。...
- 質問62 あなたの会社には、レポートをページングした植え替えソリューシ
- 質問63 Azure Cognitive Search カスタム スキルを構築しています。 次...
- 質問64 Azure Cognitive Search の AI エンリッチメント パイプラインを...
- 質問65 Face APIの呼び出しを開発しています。この呼び出しでは、既存の...
- 質問66 食品用の段ボール包装を生産する工場を経営しています。工場のイ
- 質問67 遠隔地の学習者向けにインターネットベースのトレーニング ソリ
- 質問68 ローカル ドライブに保存されている File1.avi という名前の 20 ...
- 質問69 Microsoft OneDrive フォルダーに、FileVavi という 20 GB の動...
- 質問70 Azure Al Speech サービスを使用して音声ファイルを翻訳するアプ...
- 質問71 次の図に示すように、Microsoft Bot Framework Composer を使用...
- 質問72 AH という名前の Azure OpenAI リソースを含む Azure サブスクリ...
- 質問73 Azure Al Video Indexer アカウントを含む Azure サブスクリプシ...
- 質問74 All という名前の Azure OpenA1 リソースを含む Azure サブスク...
- 質問75 あなたは製品作成プロジェクトを計画しています。 ビデオを分析
- 質問76 Azure Cognitive Search ソリューションと、カテゴリフィールド...
- 質問77 Foundry Tools サービスで Azure Translator を使用するメッセー...
- 質問78 チャットボットで使用する会話フローを設計しています。 Microso...
- 質問79 どのデータベーストランザクションプロパティが、個々のトランザ
- 質問80 DM という名前の Azure Al Document Intelligence リソースを含...
- 質問81 CS1 という名前の Azure AI コンテンツ セーフティ リソースを含...
- 質問82 テキストを音声に変換するソーシャルメディア拡張機能を構築して
- 質問83 注:この質問は、同じシナリオを提示する一連の質問の一部です。
- 質問84 テキストファイル、ビデオ、オーディオストリーム、および仮想デ
- 質問85 次の方法を使用して、Azure AI サービス リソースをプロビジョニ...
- 質問86 Microsoft Bot Framework Composer を使用してチャットボットを...
- 質問87 Azure Al Languageカスタム質問応答サービスを使用するチャット...
- 質問88 アップロードされた画像のタグリストを生成するアプリを構築する
- 質問89 Azure AIとカスタムトレーニング済みの分類器を使用して画像内の...
- 質問90 リアルタイム推論のために、Azure Machine Learning のマネージ...
- 質問91 Azure Blob StorageからBLOBを自動的に削除するには、何を使用す...
- 質問92 1,000 個のビデオ ファイルを含むライブラリがあります。 Azure ...
- 質問93 iOS アプリで使用されるモデルを構築しています。 猫と犬の画像...
- 質問94 契約書類を認識するためにカスタムAzure AI Document Intelligen...
- 質問95 Azure Al Foundry エージェント サービスを使用してエージェント...
- 質問96 ユーザーがアップロードした複数のファイルを結合して処理するエ
- 質問97 フィードバックを管理するアプリがあります。 Azure Cognitive S...
- 質問98 インターネットベースのトレーニングソリューションの構築に成功
- 質問99 注: この問題は、同じシナリオを提示する一連の問題の一部です。...
- 質問100 AI Language カスタム質問回答サービスを使用するアプリがありま...
- 質問101 注: この問題は、同じシナリオを提示する一連の問題の一部です。...
- 質問102 言語翻訳を含むアプリケーションを開発しています。 アプリケー
- 質問103 トランザクションワークロードのどのプロパティが、各トランザク
- 質問104 開発環境に acvdev という名前の Custom Vision リソースがあり...
- 質問105 Azure サービスをアーキテクチャ内の適切な場所に一致させます。...
- 質問106 Microsoft Foundry リソースを含む Azure サブスクリプションが...
- 質問107 Custom Vision サービスを使用して分類子を構築します。 トレー...
- 質問108 Azure Cognitive Search を使用してナレッジベースを開発してい...
- 質問109 チャットボットを開発しています。 次のコンポーネントを作成し
- 質問110 Azure OpenAI GPT 3.5 モデルを使用するチャットボットを構築し...
- 質問111 予測メンテナンスを実行する予定です。 100台の産業機械から1年...
- 質問112 ビデオ トレーニング ソリューションのコンテンツを作成していま...
- 質問113 resource1 という名前の Azure Al Foundry Content Safety リソ...
- 質問114 注: この問題は、同じシナリオを提示する一連の問題の一部です。...
- 質問115 機械から一連のデータを受信するAzure IoTハブがあります。以下...
- 質問116 文を正しく完成させる答えを選択してください。 (Exhibit)...
- 質問117 音声サンプルをSpeechStudioプロジェクトにアップロードする必要...
- 質問118 データウェアハウスの主な目的は何ですか?
- 質問119 AM という名前の Azure OpenAI リソースを含む Azure サブスクリ...
- 質問120 Azureサブスクリプションに、Azure AIコンテンツセーフティリソ...
- 質問121 経営幹部にデータを提供するためのソリューションを開発する必要
- 質問122 Microsoft Bot Framework Composer を使用してチャットボットを...
- 質問123 Azure Stream Analyticsのストリーム処理ジョブでクエリを定義す...
- 質問124 機密文書をスキャンし、言語サービスを使用して内容を分析するア
- 質問125 注: この質問は、同じシナリオを示す一連の質問の一部です。この...
- 質問126 生産ライン上の不良品を識別するための Azure AI ソリューション...
- 質問127 Computer Visionクライアントライブラリを使用するメソッドを開...
- 質問128 手書きのアンケート回答をスキャンした画像が1,000枚あります。...
- 質問129 チャットボットがあります。 Bot Framework Emulatorを使用して...
- 質問130 カスタム API を使用して、特定の場所の現在の時刻を取得するエ...
- 質問131 ユーザーが画像をアップロードできるアプリを構築しています。ソ
- 質問132 Azure Al Language サービスを使用してドキュメントを分析するア...
- 質問133 顧客データと注文データを組み合わせたSQLクエリがあります a。...
- 質問134 PDF 形式で保存されている人事 (HR) ポリシーに関する質問に答え...
- 質問135 言語理解モデルを使用してテキスト ファイルを分析するアプリを
- 質問136 次のデータ ソースがあります。 財務: オンプレミスの Microsoft...
- 質問137 CS1 という名前の Azure AI コンテンツ セーフティ リソースを含...
- 質問138 顧客は Azure Cognitive Search を使用します。 顧客は、サーバ...
- 質問139 Azure Cognitive Service for Language でカスタムの質問応答プ...
- 質問140 顔認識APIを使用して従業員の顔を認識するアプリケーションを開...
- 質問141 AH という名前の Azure OpenAI リソースと CS1 という名前の Azu...
- 質問142 AlSearch1 という名前の Azure Al Search インスタンスを含む Az...
- 質問143 QnA Maker サービスを使用する小売チャットボットを構築していま...
- 質問144 Microsoft Bot Framework SDK を使用してチャットボットを構築し...
- 質問145 次の展示に示すように、四半期ごとの現在の売上合計の視覚化を作
- 質問146 Azure Al Languageでカスタム質問応答プロジェクトを開発します...
- 質問147 Azure Cognitive Search ソリューションと、JPEG ファイルとして...
- 質問148 Azure サブスクリプションをお持ちです。 Azure Al Document Int...
- 質問149 以下の各文について、正しい場合は「はい」を選択してください。
- 質問150 cu1 という名前の Azure AI コンテンツ理解リソースを含む Azure...
- 質問151 テキストベースのチャットボットがあります。 Content Moderator...
- 質問152 既存の Azure Cognitive Search サービスがあります。 画像や PD...
- 質問153 チャットボットの設計をレビューしています。チャットボットには
- 質問154 Azure AI 検索を使用する Web アプリがあります。 アクティビテ...
- 質問155 Form Recognizer を使用して注文書のインデックスを作成する Azu...
- 質問156 Project1 という名前の Microsoft Foundry プロジェクトがありま...
- 質問157 Speech and Language API を使用するアプリを開発しています。 ...
- 質問158 次のファイルがあります: * ファイル1.pdf * ファイル2.jpg * フ...
- 質問159 Azure Cosmos DB API を適切なデータ構造に一致させます。 回答...
- 質問160 ソーシャル メディア メッセージング アプリを構築しています。 ...
- 質問161 Microsoft Bot Framework Composer を使用してチャットボットを...
- 質問162 注: この問題は、同じシナリオを提示する一連の問題の一部です。...
- 質問163 データストリームから温度データを監視するシステムを開発してい
- 質問164 注: この問題は、同じシナリオを提示する一連の問題の一部です。...
- 質問165 App1 というアプリがあり、Azure Cognitive Services モデルを使...
- 質問166 Azure Cognitive Search を使用するエンリッチメント パイプライ...
- 質問167 文を正しく完成させる答えを選択してください。 (Exhibit)...
- 質問168 文を正しく完成させる答えを選択してください。 (Exhibit)...
- 質問169 受信メールを処理し、メール メッセージをフランス語または英語
- 質問170 JavaScript でボットを構築します。 Azure コマンド ライン イン...
- 質問171 あなたの会社では、Azure Cognitive Services ソリューションを...
- 質問172 あなたは、公開されているWebサイトからのビデオとテキストを処...
- 質問173 Aldoc1 という名前の Azure Al Document Intelligence リソース...
- 質問174 チャットボットを構築しています。 ナレッジベースを照会するよ
- 質問175 複数のアプリで使用される Search 1 という名前の Azure Cogniti...
- 質問176 Azure AI Speechサービスのテキスト読み上げ機能を利用するアプ...
- 質問177 Azure Al Agent サービスを使用してエージェントを構築していま...
- 質問178 Azure AI を使用してワークスペースの安全規制コンプライアンス...
- 質問179 Azure AI サービスを使用して、音声を英語からフランス語、ドイ...
- 質問180 非リレーショナルデータベースの特徴は何ですか?
- 質問181 Speech SDKを使用してアプリを構築しています。このアプリは、自...
- 質問182 D1 という名前の Azure AI ドキュメント インテリジェンス リソ...
- 質問183 会話型言語理解モデルをトレーニングして、ユーザーの自然言語入
- 質問184 オブジェクト検出を実行するカスタムビジョンサービスプロジェク
- 質問185 データ視覚化の2つの用途を食べたのは何ですか?それぞれの正解
- 質問186 Al1 という Azure OpenAl リソースがあり、GPT 3.5 モデルの 3 ...
- 質問187 リレーショナルデータベースの主な特徴は何ですか?
- 質問188 Azure Al Language を使用してテキスト メッセージから意味を抽...
- 質問189 工場の生産ラインで生産された不良コンポーネントを検出するアプ
- 質問190 All という名前の Azure OpenAI モデルがあります。 Azure OpenA...
- 質問191 Face API を使用して、サンプル画像に基づいて人物の写真を検索...
- 質問192 Azure Al Vision クライアントライブラリを使用するアプリケーシ...
- 質問193 次の表に示すファイルを含むローカル フォルダーがあります。 (E...
- 質問194 ユーザー画像を共有するアプリを構築しています。 ユーザーが画
- 質問195 カスタム ニューラル音声を使用する小売キオスク システムを構築...
- 質問196 All という名前の Azure OpenAI リソースと User1 という名前の...
- 質問197 多言語チャットボットを構築しています。 ポジティブメッセージ
- 質問198 次のC#メソッドがあります。 (Exhibit) Azureリソースを米国東...
- 質問199 注: この問題は、同じシナリオを提示する一連の問題の一部です。...
- 質問200 社内ドキュメントに Azure Cognitive Search を使用するアプリケ...
- 質問201 言語翻訳を含むアプリケーションを開発しています。 アプリケー
- 質問202 お客様は、All という名前の Azure AI Document Intelligence リ...
- 質問203 あなたの会社は、従業員が経費報告書に領収書を記入するのにかか
- 質問204 Azure AI Document Intelligence を使用して患者の医療データを...

